|
| enum | ChartStyle { Grouped,
Stacked
} |
| | Chart styles. More...
|
| |
| enum | LayoutPolicy { AutoAdjustSamples,
ScaleSamplesToAxes,
ScaleSampleToCanvas,
FixedSampleSize
} |
| | Mode how to calculate the bar width. More...
|
| |
| enum | RttiValues {
Rtti_PlotItem = 0,
Rtti_PlotGrid,
Rtti_PlotScale,
Rtti_PlotLegend,
Rtti_PlotMarker,
Rtti_PlotCurve,
Rtti_PlotSpectroCurve,
Rtti_PlotIntervalCurve,
Rtti_PlotHistogram,
Rtti_PlotSpectrogram,
Rtti_PlotSVG,
Rtti_PlotTradingCurve,
Rtti_PlotBarChart,
Rtti_PlotMultiBarChart,
Rtti_PlotShape,
Rtti_PlotTextLabel,
Rtti_PlotZone,
Rtti_PlotUserItem = 1000
} |
| | Runtime type information. More...
|
| |
| enum | ItemAttribute { Legend = 0x01,
AutoScale = 0x02,
Margins = 0x04
} |
| | Plot Item Attributes. More...
|
| |
| enum | ItemInterest { ScaleInterest = 0x01,
LegendInterest = 0x02
} |
| | Plot Item Interests. More...
|
| |
| enum | RenderHint { RenderAntialiased = 0x1
} |
| | Render hints. More...
|
| |
|
typedef QFlags< ItemAttribute > | ItemAttributes |
| | Plot Item Attributes.
|
| |
|
typedef QFlags< ItemInterest > | ItemInterests |
| | Plot Item Interests.
|
| |
|
typedef QFlags< RenderHint > | RenderHints |
| | Render hints.
|
| |
|
| | QwtPlotMultiBarChart (const QString &title=QString::null) |
| |
| | QwtPlotMultiBarChart (const QwtText &title) |
| |
|
virtual | ~QwtPlotMultiBarChart () |
| | Destructor.
|
| |
| virtual int | rtti () const |
| |
| void | setBarTitles (const QList< QwtText > &) |
| | Set the titles for the bars. More...
|
| |
| QList< QwtText > | barTitles () const |
| |
| void | setSamples (const QVector< QwtSetSample > &) |
| |
| void | setSamples (const QVector< QVector< double > > &) |
| |
| void | setSamples (QwtSeriesData< QwtSetSample > *) |
| |
| void | setStyle (ChartStyle style) |
| |
| ChartStyle | style () const |
| |
| void | setSymbol (int barIndex, QwtColumnSymbol *symbol) |
| | Add a symbol to the symbol map. More...
|
| |
| const QwtColumnSymbol * | symbol (int barIndex) const |
| |
| void | resetSymbolMap () |
| |
| virtual void | drawSeries (QPainter *painter, const QwtScaleMap &xMap, const QwtScaleMap &yMap, const QRectF &canvasRect, int from, int to) const |
| |
| virtual QRectF | boundingRect () const |
| |
| virtual QList< QwtLegendData > | legendData () const |
| |
| virtual QwtGraphic | legendIcon (int index, const QSizeF &) const |
| |
| | QwtPlotAbstractBarChart (const QwtText &title) |
| |
|
virtual | ~QwtPlotAbstractBarChart () |
| | Destructor.
|
| |
| void | setLayoutPolicy (LayoutPolicy) |
| |
| LayoutPolicy | layoutPolicy () const |
| |
| void | setLayoutHint (double) |
| |
| double | layoutHint () const |
| |
| void | setSpacing (int) |
| | Set the spacing. More...
|
| |
| int | spacing () const |
| |
| void | setMargin (int) |
| | Set the margin. More...
|
| |
| int | margin () const |
| |
| void | setBaseline (double) |
| | Set the baseline. More...
|
| |
| double | baseline () const |
| |
| virtual void | getCanvasMarginHint (const QwtScaleMap &xMap, const QwtScaleMap &yMap, const QRectF &canvasRect, double &left, double &top, double &right, double &bottom) const |
| | Calculate a hint for the canvas margin. More...
|
| |
| | QwtPlotSeriesItem (const QString &title=QString::null) |
| |
| | QwtPlotSeriesItem (const QwtText &title) |
| |
|
virtual | ~QwtPlotSeriesItem () |
| | Destructor.
|
| |
| void | setOrientation (Qt::Orientation) |
| |
| Qt::Orientation | orientation () const |
| |
| virtual void | draw (QPainter *p, const QwtScaleMap &xMap, const QwtScaleMap &yMap, const QRectF &) const |
| | Draw the complete series. More...
|
| |
| virtual void | updateScaleDiv (const QwtScaleDiv &, const QwtScaleDiv &) |
| | Update the item to changes of the axes scale division. More...
|
| |
| | QwtPlotItem (const QwtText &title=QwtText()) |
| |
|
virtual | ~QwtPlotItem () |
| | Destroy the QwtPlotItem.
|
| |
| void | attach (QwtPlot *plot) |
| | Attach the item to a plot. More...
|
| |
| void | detach () |
| | This method detaches a QwtPlotItem from any QwtPlot it has been associated with. More...
|
| |
|
QwtPlot * | plot () const |
| | Return attached plot.
|
| |
| void | setTitle (const QString &title) |
| |
| void | setTitle (const QwtText &title) |
| |
| const QwtText & | title () const |
| |
| void | setItemAttribute (ItemAttribute, bool on=true) |
| |
| bool | testItemAttribute (ItemAttribute) const |
| |
| void | setItemInterest (ItemInterest, bool on=true) |
| |
| bool | testItemInterest (ItemInterest) const |
| |
| void | setRenderHint (RenderHint, bool on=true) |
| |
| bool | testRenderHint (RenderHint) const |
| |
| void | setRenderThreadCount (uint numThreads) |
| |
| uint | renderThreadCount () const |
| |
| void | setLegendIconSize (const QSize &) |
| |
| QSize | legendIconSize () const |
| |
| double | z () const |
| |
| void | setZ (double z) |
| | Set the z value. More...
|
| |
|
void | show () |
| | Show the item.
|
| |
|
void | hide () |
| | Hide the item.
|
| |
| virtual void | setVisible (bool) |
| |
| bool | isVisible () const |
| |
| void | setAxes (int xAxis, int yAxis) |
| |
| void | setXAxis (int axis) |
| |
|
int | xAxis () const |
| | Return xAxis.
|
| |
| void | setYAxis (int axis) |
| |
|
int | yAxis () const |
| | Return yAxis.
|
| |
| virtual void | itemChanged () |
| |
| virtual void | legendChanged () |
| |
| virtual void | updateLegend (const QwtPlotItem *, const QList< QwtLegendData > &) |
| | Update the item to changes of the legend info. More...
|
| |
| QRectF | scaleRect (const QwtScaleMap &, const QwtScaleMap &) const |
| | Calculate the bounding scale rectangle of 2 maps. More...
|
| |
| QRectF | paintRect (const QwtScaleMap &, const QwtScaleMap &) const |
| | Calculate the bounding paint rectangle of 2 maps. More...
|
| |
|
| QwtSeriesStore () |
| | Constructor The store contains no series.
|
| |
|
| ~QwtSeriesStore () |
| | Destructor.
|
| |
| void | setData (QwtSeriesData< QwtSetSample > *series) |
| |
| QwtSeriesData< QwtSetSample > * | data () |
| |
const QwtSeriesData
< QwtSetSample > * | data () const |
| |
| QwtSetSample | sample (int index) const |
| |
| virtual size_t | dataSize () const |
| |
| virtual QRectF | dataRect () const |
| |
| virtual void | setRectOfInterest (const QRectF &rect) |
| |
| QwtSeriesData< QwtSetSample > * | swapData (QwtSeriesData< QwtSetSample > *series) |
| |
|
| QwtColumnSymbol * | symbol (int barIndex) |
| |
| virtual QwtColumnSymbol * | specialSymbol (int sampleIndex, int valueIndex) const |
| | Create a symbol for special values. More...
|
| |
| virtual void | drawSample (QPainter *painter, const QwtScaleMap &xMap, const QwtScaleMap &yMap, const QRectF &canvasRect, const QwtInterval &boundingInterval, int index, const QwtSetSample &sample) const |
| |
| virtual void | drawBar (QPainter *, int sampleIndex, int barIndex, const QwtColumnRect &) const |
| |
| void | drawStackedBars (QPainter *painter, const QwtScaleMap &xMap, const QwtScaleMap &yMap, const QRectF &canvasRect, int index, double sampleWidth, const QwtSetSample &sample) const |
| |
| void | drawGroupedBars (QPainter *painter, const QwtScaleMap &xMap, const QwtScaleMap &yMap, const QRectF &canvasRect, int index, double sampleWidth, const QwtSetSample &sample) const |
| |
| double | sampleWidth (const QwtScaleMap &map, double canvasSize, double dataSize, double value) const |
| |
|
virtual void | dataChanged () |
| | dataChanged() indicates, that the series has been changed.
|
| |
| QwtGraphic | defaultIcon (const QBrush &, const QSizeF &) const |
| | Return a default icon from a brush. More...
|
| |
|
virtual | ~QwtAbstractSeriesStore () |
| | Destructor.
|
| |
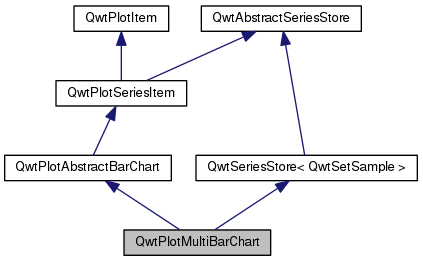
QwtPlotMultiBarChart displays a series of a samples that consist each of a set of values.
Each value is displayed as a bar, the bars of each set can be organized side by side or accumulated.
Each bar of a set is rendered by a QwtColumnSymbol, that is set by setSymbol(). The bars of different sets use the same symbols. Exceptions are possible by overloading specialSymbol() or overloading drawBar().
Depending on its orientation() the bars are displayed horizontally or vertically. The bars cover the interval between the baseline() and the value.
In opposite to most other plot items, QwtPlotMultiBarChart returns more than one entry for the legend - one for each symbol.
- See Also
- QwtPlotBarChart, QwtPlotHistogram QwtPlotSeriesItem::orientation(), QwtPlotAbstractBarChart::baseline()
| QwtColumnSymbol * QwtPlotMultiBarChart::specialSymbol |
( |
int |
sampleIndex, |
|
|
int |
valueIndex |
|
) |
| const |
|
protectedvirtual |
Create a symbol for special values.
Usually the symbols for displaying a bar are set by setSymbols() and common for all sets. By overloading specialSymbol() it is possible to create a temporary symbol() for displaying a special value.
The symbol has to be created by new each time specialSymbol() is called. As soon as the symbol is painted this symbol gets deleted.
When no symbol ( NULL ) is returned, the value will be displayed with the standard symbol that is used for all symbols with the same valueIndex.
- Parameters
-
| sampleIndex | Index of the sample |
| valueIndex | Index of the value in the set |
- Returns
- NULL, meaning that the value is not special
 Public Member Functions inherited from QwtPlotAbstractBarChart
 1.8.5
1.8.5

