|
| enum | LegendMode { LegendChartTitle,
LegendBarTitles
} |
| | Legend modes. More...
|
| |
| enum | LayoutPolicy { AutoAdjustSamples,
ScaleSamplesToAxes,
ScaleSampleToCanvas,
FixedSampleSize
} |
| | Mode how to calculate the bar width. More...
|
| |
| enum | RttiValues {
Rtti_PlotItem = 0,
Rtti_PlotGrid,
Rtti_PlotScale,
Rtti_PlotLegend,
Rtti_PlotMarker,
Rtti_PlotCurve,
Rtti_PlotSpectroCurve,
Rtti_PlotIntervalCurve,
Rtti_PlotHistogram,
Rtti_PlotSpectrogram,
Rtti_PlotSVG,
Rtti_PlotTradingCurve,
Rtti_PlotBarChart,
Rtti_PlotMultiBarChart,
Rtti_PlotShape,
Rtti_PlotTextLabel,
Rtti_PlotZone,
Rtti_PlotUserItem = 1000
} |
| | Runtime type information. More...
|
| |
| enum | ItemAttribute { Legend = 0x01,
AutoScale = 0x02,
Margins = 0x04
} |
| | Plot Item Attributes. More...
|
| |
| enum | ItemInterest { ScaleInterest = 0x01,
LegendInterest = 0x02
} |
| | Plot Item Interests. More...
|
| |
| enum | RenderHint { RenderAntialiased = 0x1
} |
| | Render hints. More...
|
| |
|
typedef QFlags< ItemAttribute > | ItemAttributes |
| | Plot Item Attributes.
|
| |
|
typedef QFlags< ItemInterest > | ItemInterests |
| | Plot Item Interests.
|
| |
|
typedef QFlags< RenderHint > | RenderHints |
| | Render hints.
|
| |
|
| | QwtPlotBarChart (const QString &title=QString::null) |
| |
| | QwtPlotBarChart (const QwtText &title) |
| |
|
virtual | ~QwtPlotBarChart () |
| | Destructor.
|
| |
| virtual int | rtti () const |
| |
| void | setSamples (const QVector< QPointF > &) |
| |
| void | setSamples (const QVector< double > &) |
| |
| void | setSamples (QwtSeriesData< QPointF > *series) |
| |
| void | setSymbol (QwtColumnSymbol *) |
| | Assign a symbol. More...
|
| |
| const QwtColumnSymbol * | symbol () const |
| |
| void | setLegendMode (LegendMode) |
| |
| LegendMode | legendMode () const |
| |
| virtual void | drawSeries (QPainter *painter, const QwtScaleMap &xMap, const QwtScaleMap &yMap, const QRectF &canvasRect, int from, int to) const |
| |
| virtual QRectF | boundingRect () const |
| |
| virtual QwtColumnSymbol * | specialSymbol (int sampleIndex, const QPointF &) const |
| |
| virtual QwtText | barTitle (int sampleIndex) const |
| | Return the title of a bar. More...
|
| |
| | QwtPlotAbstractBarChart (const QwtText &title) |
| |
|
virtual | ~QwtPlotAbstractBarChart () |
| | Destructor.
|
| |
| void | setLayoutPolicy (LayoutPolicy) |
| |
| LayoutPolicy | layoutPolicy () const |
| |
| void | setLayoutHint (double) |
| |
| double | layoutHint () const |
| |
| void | setSpacing (int) |
| | Set the spacing. More...
|
| |
| int | spacing () const |
| |
| void | setMargin (int) |
| | Set the margin. More...
|
| |
| int | margin () const |
| |
| void | setBaseline (double) |
| | Set the baseline. More...
|
| |
| double | baseline () const |
| |
| virtual void | getCanvasMarginHint (const QwtScaleMap &xMap, const QwtScaleMap &yMap, const QRectF &canvasRect, double &left, double &top, double &right, double &bottom) const |
| | Calculate a hint for the canvas margin. More...
|
| |
| | QwtPlotSeriesItem (const QString &title=QString::null) |
| |
| | QwtPlotSeriesItem (const QwtText &title) |
| |
|
virtual | ~QwtPlotSeriesItem () |
| | Destructor.
|
| |
| void | setOrientation (Qt::Orientation) |
| |
| Qt::Orientation | orientation () const |
| |
| virtual void | draw (QPainter *p, const QwtScaleMap &xMap, const QwtScaleMap &yMap, const QRectF &) const |
| | Draw the complete series. More...
|
| |
| virtual void | updateScaleDiv (const QwtScaleDiv &, const QwtScaleDiv &) |
| | Update the item to changes of the axes scale division. More...
|
| |
| | QwtPlotItem (const QwtText &title=QwtText()) |
| |
|
virtual | ~QwtPlotItem () |
| | Destroy the QwtPlotItem.
|
| |
| void | attach (QwtPlot *plot) |
| | Attach the item to a plot. More...
|
| |
| void | detach () |
| | This method detaches a QwtPlotItem from any QwtPlot it has been associated with. More...
|
| |
|
QwtPlot * | plot () const |
| | Return attached plot.
|
| |
| void | setTitle (const QString &title) |
| |
| void | setTitle (const QwtText &title) |
| |
| const QwtText & | title () const |
| |
| void | setItemAttribute (ItemAttribute, bool on=true) |
| |
| bool | testItemAttribute (ItemAttribute) const |
| |
| void | setItemInterest (ItemInterest, bool on=true) |
| |
| bool | testItemInterest (ItemInterest) const |
| |
| void | setRenderHint (RenderHint, bool on=true) |
| |
| bool | testRenderHint (RenderHint) const |
| |
| void | setRenderThreadCount (uint numThreads) |
| |
| uint | renderThreadCount () const |
| |
| void | setLegendIconSize (const QSize &) |
| |
| QSize | legendIconSize () const |
| |
| double | z () const |
| |
| void | setZ (double z) |
| | Set the z value. More...
|
| |
|
void | show () |
| | Show the item.
|
| |
|
void | hide () |
| | Hide the item.
|
| |
| virtual void | setVisible (bool) |
| |
| bool | isVisible () const |
| |
| void | setAxes (int xAxis, int yAxis) |
| |
| void | setXAxis (int axis) |
| |
|
int | xAxis () const |
| | Return xAxis.
|
| |
| void | setYAxis (int axis) |
| |
|
int | yAxis () const |
| | Return yAxis.
|
| |
| virtual void | itemChanged () |
| |
| virtual void | legendChanged () |
| |
| virtual void | updateLegend (const QwtPlotItem *, const QList< QwtLegendData > &) |
| | Update the item to changes of the legend info. More...
|
| |
| QRectF | scaleRect (const QwtScaleMap &, const QwtScaleMap &) const |
| | Calculate the bounding scale rectangle of 2 maps. More...
|
| |
| QRectF | paintRect (const QwtScaleMap &, const QwtScaleMap &) const |
| | Calculate the bounding paint rectangle of 2 maps. More...
|
| |
|
| QwtSeriesStore () |
| | Constructor The store contains no series.
|
| |
|
| ~QwtSeriesStore () |
| | Destructor.
|
| |
| void | setData (QwtSeriesData< QPointF > *series) |
| |
| QwtSeriesData< QPointF > * | data () |
| |
| const QwtSeriesData< QPointF > * | data () const |
| |
| QPointF | sample (int index) const |
| |
| virtual size_t | dataSize () const |
| |
| virtual QRectF | dataRect () const |
| |
| virtual void | setRectOfInterest (const QRectF &rect) |
| |
| QwtSeriesData< QPointF > * | swapData (QwtSeriesData< QPointF > *series) |
| |
|
| virtual void | drawSample (QPainter *painter, const QwtScaleMap &xMap, const QwtScaleMap &yMap, const QRectF &canvasRect, const QwtInterval &boundingInterval, int index, const QPointF &sample) const |
| |
| virtual void | drawBar (QPainter *, int sampleIndex, const QPointF &point, const QwtColumnRect &) const |
| |
| QList< QwtLegendData > | legendData () const |
| | Return all information, that is needed to represent the item on the legend. More...
|
| |
| QwtGraphic | legendIcon (int index, const QSizeF &) const |
| |
| double | sampleWidth (const QwtScaleMap &map, double canvasSize, double dataSize, double value) const |
| |
|
virtual void | dataChanged () |
| | dataChanged() indicates, that the series has been changed.
|
| |
| QwtGraphic | defaultIcon (const QBrush &, const QSizeF &) const |
| | Return a default icon from a brush. More...
|
| |
|
virtual | ~QwtAbstractSeriesStore () |
| | Destructor.
|
| |
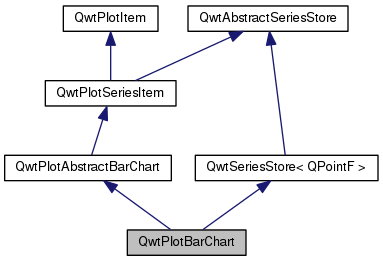
QwtPlotBarChart displays a series of a values as bars.
Each bar might be customized individually by implementing a specialSymbol(). Otherwise it is rendered using a default symbol.
Depending on its orientation() the bars are displayed horizontally or vertically. The bars cover the interval between the baseline() and the value.
By activating the LegendBarTitles mode each sample will have its own entry on the legend.
The most common use case of a bar chart is to display a list of y coordinates, where the x coordinate is simply the index in the list. But for other situations ( f.e. when values are related to dates ) it is also possible to set x coordinates explicitly.
- See Also
- QwtPlotMultiBarChart, QwtPlotHistogram, QwtPlotCurve::Sticks, QwtPlotSeriesItem::orientation(), QwtPlotAbstractBarChart::baseline()
 Public Member Functions inherited from QwtPlotAbstractBarChart
 1.8.5
1.8.5

