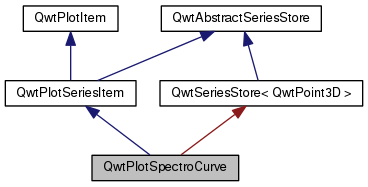
Curve that displays 3D points as dots, where the z coordinate is mapped to a color.
More...
|
| enum | PaintAttribute { ClipPoints = 1
} |
| | Paint attributes. More...
|
| |
|
typedef QFlags< PaintAttribute > | PaintAttributes |
| | Paint attributes.
|
| |
| enum | RttiValues {
Rtti_PlotItem = 0,
Rtti_PlotGrid,
Rtti_PlotScale,
Rtti_PlotLegend,
Rtti_PlotMarker,
Rtti_PlotCurve,
Rtti_PlotSpectroCurve,
Rtti_PlotIntervalCurve,
Rtti_PlotHistogram,
Rtti_PlotSpectrogram,
Rtti_PlotSVG,
Rtti_PlotTradingCurve,
Rtti_PlotBarChart,
Rtti_PlotMultiBarChart,
Rtti_PlotShape,
Rtti_PlotTextLabel,
Rtti_PlotZone,
Rtti_PlotUserItem = 1000
} |
| | Runtime type information. More...
|
| |
| enum | ItemAttribute { Legend = 0x01,
AutoScale = 0x02,
Margins = 0x04
} |
| | Plot Item Attributes. More...
|
| |
| enum | ItemInterest { ScaleInterest = 0x01,
LegendInterest = 0x02
} |
| | Plot Item Interests. More...
|
| |
| enum | RenderHint { RenderAntialiased = 0x1
} |
| | Render hints. More...
|
| |
|
typedef QFlags< ItemAttribute > | ItemAttributes |
| | Plot Item Attributes.
|
| |
|
typedef QFlags< ItemInterest > | ItemInterests |
| | Plot Item Interests.
|
| |
|
typedef QFlags< RenderHint > | RenderHints |
| | Render hints.
|
| |
|
| | QwtPlotSpectroCurve (const QString &title=QString::null) |
| |
| | QwtPlotSpectroCurve (const QwtText &title) |
| |
|
virtual | ~QwtPlotSpectroCurve () |
| | Destructor.
|
| |
| virtual int | rtti () const |
| |
| void | setPaintAttribute (PaintAttribute, bool on=true) |
| |
| bool | testPaintAttribute (PaintAttribute) const |
| |
| void | setSamples (const QVector< QwtPoint3D > &) |
| |
| void | setSamples (QwtSeriesData< QwtPoint3D > *) |
| |
| void | setColorMap (QwtColorMap *) |
| |
| const QwtColorMap * | colorMap () const |
| |
| void | setColorRange (const QwtInterval &) |
| |
| QwtInterval & | colorRange () const |
| |
| virtual void | drawSeries (QPainter *, const QwtScaleMap &xMap, const QwtScaleMap &yMap, const QRectF &canvasRect, int from, int to) const |
| |
| void | setPenWidth (double width) |
| |
| double | penWidth () const |
| |
| | QwtPlotSeriesItem (const QString &title=QString::null) |
| |
| | QwtPlotSeriesItem (const QwtText &title) |
| |
|
virtual | ~QwtPlotSeriesItem () |
| | Destructor.
|
| |
| void | setOrientation (Qt::Orientation) |
| |
| Qt::Orientation | orientation () const |
| |
| virtual void | draw (QPainter *p, const QwtScaleMap &xMap, const QwtScaleMap &yMap, const QRectF &) const |
| | Draw the complete series. More...
|
| |
| virtual QRectF | boundingRect () const |
| |
| virtual void | updateScaleDiv (const QwtScaleDiv &, const QwtScaleDiv &) |
| | Update the item to changes of the axes scale division. More...
|
| |
| | QwtPlotItem (const QwtText &title=QwtText()) |
| |
|
virtual | ~QwtPlotItem () |
| | Destroy the QwtPlotItem.
|
| |
| void | attach (QwtPlot *plot) |
| | Attach the item to a plot. More...
|
| |
| void | detach () |
| | This method detaches a QwtPlotItem from any QwtPlot it has been associated with. More...
|
| |
|
QwtPlot * | plot () const |
| | Return attached plot.
|
| |
| void | setTitle (const QString &title) |
| |
| void | setTitle (const QwtText &title) |
| |
| const QwtText & | title () const |
| |
| void | setItemAttribute (ItemAttribute, bool on=true) |
| |
| bool | testItemAttribute (ItemAttribute) const |
| |
| void | setItemInterest (ItemInterest, bool on=true) |
| |
| bool | testItemInterest (ItemInterest) const |
| |
| void | setRenderHint (RenderHint, bool on=true) |
| |
| bool | testRenderHint (RenderHint) const |
| |
| void | setRenderThreadCount (uint numThreads) |
| |
| uint | renderThreadCount () const |
| |
| void | setLegendIconSize (const QSize &) |
| |
| QSize | legendIconSize () const |
| |
| double | z () const |
| |
| void | setZ (double z) |
| | Set the z value. More...
|
| |
|
void | show () |
| | Show the item.
|
| |
|
void | hide () |
| | Hide the item.
|
| |
| virtual void | setVisible (bool) |
| |
| bool | isVisible () const |
| |
| void | setAxes (int xAxis, int yAxis) |
| |
| void | setXAxis (int axis) |
| |
|
int | xAxis () const |
| | Return xAxis.
|
| |
| void | setYAxis (int axis) |
| |
|
int | yAxis () const |
| | Return yAxis.
|
| |
| virtual void | itemChanged () |
| |
| virtual void | legendChanged () |
| |
| virtual void | getCanvasMarginHint (const QwtScaleMap &xMap, const QwtScaleMap &yMap, const QRectF &canvasSize, double &left, double &top, double &right, double &bottom) const |
| | Calculate a hint for the canvas margin. More...
|
| |
| virtual void | updateLegend (const QwtPlotItem *, const QList< QwtLegendData > &) |
| | Update the item to changes of the legend info. More...
|
| |
| QRectF | scaleRect (const QwtScaleMap &, const QwtScaleMap &) const |
| | Calculate the bounding scale rectangle of 2 maps. More...
|
| |
| QRectF | paintRect (const QwtScaleMap &, const QwtScaleMap &) const |
| | Calculate the bounding paint rectangle of 2 maps. More...
|
| |
| virtual QList< QwtLegendData > | legendData () const |
| | Return all information, that is needed to represent the item on the legend. More...
|
| |
| virtual QwtGraphic | legendIcon (int index, const QSizeF &) const |
| |
Curve that displays 3D points as dots, where the z coordinate is mapped to a color.
 Public Member Functions inherited from QwtPlotSeriesItem
 1.8.5
1.8.5

