#include <qwt_plot_svgitem.h>
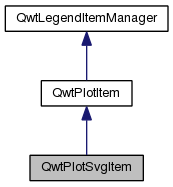
Inheritance diagram for QwtPlotSvgItem:
Public Member Functions | |
| QwtPlotSvgItem (const QString &title=QString::null) | |
| QwtPlotSvgItem (const QwtText &title) | |
| virtual | ~QwtPlotSvgItem () |
| virtual QwtDoubleRect | boundingRect () const |
| virtual void | draw (QPainter *p, const QwtScaleMap &xMap, const QwtScaleMap &yMap, const QRect &rect) const |
| bool | loadData (const QwtDoubleRect &, const QByteArray &) |
| bool | loadFile (const QwtDoubleRect &, const QString &fileName) |
| virtual int | rtti () const |
 Public Member Functions inherited from QwtPlotItem Public Member Functions inherited from QwtPlotItem | |
| QwtPlotItem (const QwtText &title=QwtText()) | |
| virtual | ~QwtPlotItem () |
| void | attach (QwtPlot *plot) |
| void | detach () |
| void | hide () |
| QwtDoubleRect | invTransform (const QwtScaleMap &, const QwtScaleMap &, const QRect &) const |
| bool | isVisible () const |
| virtual void | itemChanged () |
| virtual QWidget * | legendItem () const |
| QRect | paintRect (const QwtScaleMap &, const QwtScaleMap &) const |
| QwtPlot * | plot () const |
| QwtDoubleRect | scaleRect (const QwtScaleMap &, const QwtScaleMap &) const |
| void | setAxis (int xAxis, int yAxis) |
| void | setItemAttribute (ItemAttribute, bool on=true) |
| void | setRenderHint (RenderHint, bool on=true) |
| void | setTitle (const QString &title) |
| void | setTitle (const QwtText &title) |
| virtual void | setVisible (bool) |
| void | setXAxis (int axis) |
| void | setYAxis (int axis) |
| void | setZ (double z) |
| void | show () |
| bool | testItemAttribute (ItemAttribute) const |
| bool | testRenderHint (RenderHint) const |
| const QwtText & | title () const |
| QRect | transform (const QwtScaleMap &, const QwtScaleMap &, const QwtDoubleRect &) const |
| virtual void | updateLegend (QwtLegend *) const |
| virtual void | updateScaleDiv (const QwtScaleDiv &, const QwtScaleDiv &) |
| int | xAxis () const |
| int | yAxis () const |
| double | z () const |
| Public Member Functions inherited from QwtLegendItemManager | |
| QwtLegendItemManager () | |
| virtual | ~QwtLegendItemManager () |
Protected Member Functions | |
| void | render (QPainter *painter, const QwtDoubleRect &viewBox, const QRect &rect) const |
| QwtDoubleRect | viewBox (const QwtDoubleRect &area) const |
Additional Inherited Members | |
| Public Types inherited from QwtPlotItem | |
| enum | ItemAttribute { Legend = 1, AutoScale = 2 } |
| enum | RenderHint { RenderAntialiased = 1 } |
| enum | RttiValues { Rtti_PlotItem = 0, Rtti_PlotGrid, Rtti_PlotScale, Rtti_PlotMarker, Rtti_PlotCurve, Rtti_PlotHistogram, Rtti_PlotSpectrogram, Rtti_PlotSVG, Rtti_PlotUserItem = 1000 } |
Detailed Description
A plot item, which displays data in Scalable Vector Graphics (SVG) format.
SVG images are often used to display maps
Constructor & Destructor Documentation
|
explicit |
Constructor.
Sets the following item attributes:
- QwtPlotItem::AutoScale: true
- QwtPlotItem::Legend: false
- Parameters:
-
title Title
|
explicit |
Constructor.
Sets the following item attributes:
- QwtPlotItem::AutoScale: true
- QwtPlotItem::Legend: false
- Parameters:
-
title Title
Member Function Documentation
|
virtual |
Draw the SVG item
- Parameters:
-
painter Painter xMap X-Scale Map yMap Y-Scale Map canvasRect Contents rect of the plot canvas
Implements QwtPlotItem.
| bool QwtPlotSvgItem::loadData | ( | const QwtDoubleRect & | rect, |
| const QByteArray & | data | ||
| ) |
Load SVG data
- Parameters:
-
rect Bounding rectangle data in SVG format
- Returns:
- true, if the SVG data could be loaded
| bool QwtPlotSvgItem::loadFile | ( | const QwtDoubleRect & | rect, |
| const QString & | fileName | ||
| ) |
Load a SVG file
- Parameters:
-
rect Bounding rectangle fileName SVG file name
- Returns:
- true, if the SVG file could be loaded
|
protected |
Render the SVG data
- Parameters:
-
painter Painter viewBox View Box, see QSvgRenderer::viewBox rect Traget rectangle on the paint device
|
virtual |
- Returns:
- QwtPlotItem::Rtti_PlotSVG
Reimplemented from QwtPlotItem.
|
protected |
Calculate the viewBox from an rect and boundingRect().
- Parameters:
-
rect Rectangle in scale coordinates
- Returns:
- viewBox View Box, see QSvgRenderer::viewBox