Diagnostics Output Window Performance Fixes for RiverWare 6.5
Gnats 5405: Diagnostics sometimes cause the RiverWare interface to freeze.
Phil Weinstein / CADSWES / May 2014 (edit 5-27-2014) -- Gnats Record -- See PDF.
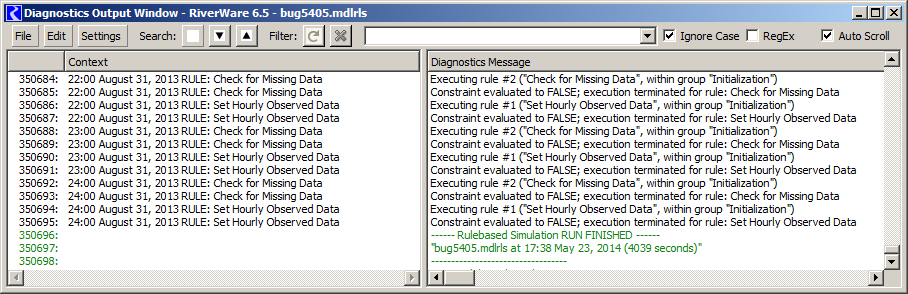
The Gnats 5405 bug model helped us identify and address two related performance problems with the Diagnostics Output Window handling a very large number of messages (e.g. > 100,000). With this model, a 35 second run takes over an hour to complete when informational diagnostics are enabled. In one case, the GUI is frozen for most of that time.
The bug model is rulebased, with 14616 hourly timesteps. 350,000+ diagnostic messages are generated. Most of those messages are generated within the first timestep -- without any intervening Qt event dispatching.
The bug report describes these two scenarios:
With Informational Diagnostics disabled in this bug model, the run
completes in about 35 seconds in both cases*
*This is with a debug build of RiverWare 6.5 development
on my 64-bit Dell Optiplex 990 Windows 7 development machine (Intel Core i7-2600 CPU, 3.40 GHz; 16 GB) in Visual Studio 2010.
The two message lists ("context" and "message") are implemented with Qt4 model/view classes -- QTreeViews (two instances) and a QAbstractTableModel (non-tree). Performance analysis shows that, given the very large number of generated messages (over 350,000), about 90% of the time is due to geometry computations in QTreeView. The view widget's append-row processing doesn't perform well with a large number of rows already in the model. Additionally a timer-based mechanism within the QTreeView intended to mitigate performance limitations gets bogged down by the huge number of unprocessed events within the first timestep, and this locks up the GUI for most of the hour-long run. (This is described in more detail below).
An "optimization" within the QAbstractItemView base class to defer processing when the view is not visible (in a hidden dialog) is ending up taking virtually all of the time repeatedly canceling and rescheduling a timer. This happens each time a notification from the QAbstractItemModel, to the QTreeViews, of rows being added. (The Qt excerpts below are from Qt 4.8.5).
void QAbstractItemView::rowsInserted(const QModelIndex &, int, int)
{
   if (!isVisible())
      d_func()->fetchMoreTimer.start(0, this); //fetch more later
   else
      updateEditorGeometries();
} |
The low-level culprit is a method involved in canceling a particular timer (before rescheduling) -- see below. The items in the thread's "postEventList" is steadily growing. After about a minute (all within the model's first timestep), the list has over 150,000 events (from which Qt is trying to remove any time-out event generated from the particular QTimer). Events are piling up faster than they can be processed or removed -- so basically, we don't get to any of the "user input" (e.g. mouse) events until the end of the run. The GUI is frozen until then.
Void QCoreApplicationPrivate::removePostedTimerEvent(QObject *object, int timerId)
{
QThreadData *data = object->d_func()->threadData;
QMutexLocker locker(&data->postEventList.mutex);
if (data->postEventList.size() == 0)
return;
for (int i = 0; i < data->postEventList.size(); ++i) {
const QPostEvent & pe = data->postEventList.at(i);
if (pe.receiver == object
&& pe.event
&& (pe.event->type() == QEvent::Timer || pe.event->type() == QEvent::ZeroTimerEvent)
&& static_cast |
Both the contribution to this event processing backlog and the impact on GUI responsiveness were mitigated by the append-message performance enhancement described in the subsequent section. However, something related to the mechanism highlighted above does still put the program into the very-slow-execution state when:
 |
Fortunately, now, (a) closing the Diagnostic Output Window or (b) clearing the diagnostic messages or (c) disabling the generation of "Informational Diagnostics" -- all of which can be done during a run -- restore the program to a reasonable execution speed.
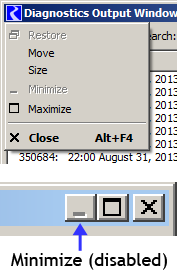
It was found that minimizing the Diagnostics Output Window does not have the profound performance benefit of closing the window -- in particular, when RiverWare has gotten into the very-slow-execution state. (No information is lost by closing the window). For this reason, the Diagnostic Output Window's "minimize" button and Window menu item have been disabled; see the accompanying screenshots. When closing the window, the DiagOutputWidget (containing the two QTreeViews) remains instantiated, but is no longer parented by a dialog widget.
The prior implementation (e.g. in RiverWare 6.4) added new messages to the model one at a time. QTreeView uses a "delayedLayout" timer ostensibly to condense a sequence of layout requests into a single operation. But it's not doing the trick. Each gets individually processed, and this gets crazily expensive for a huge list. Performance progressively slows. Nothing particularly stands out -- it's just that QTreeView's basic QModelIndex machinery doesn't scale well.
Virtually all of the time is spent in QTreeView::doItemsLayout() called for the "delayedLayout" timer. We get down to a low level where time is distributed between basic Qt item model/view functions -- components of a total of 87% of the entire execution time, just for that method ...
Basically, the architecture based around QModelIndex is generalized (way overly, I would say) to support all sorts of data topologies. It's unfortunate that a flat list has to go through all of that. Notice that 25% of the whole layout process is dedicated to the construction and destruction of QModelIndex objects ... just for conveying row numbers. QTreeView's row visibility state (this is in the view, not the model) is designed for sparsely hidden rows -- also not efficient for typical "filtering" use cases. Overall, very little of the execution profile is relevant for the diagnostic output message display lists. At some point, we will probably want to bail from use of this general Qt item model/view list (flat tree view) for these display lists.
The basic solution to most performance problem scenarios was to deploy our own timer to condense multiple (typically 100 to 1000 messages using this bug model in my debug environment) into a single append-multiple-rows operation. However, the internal architecture overhead still causes the QTreeView to get bogged down in some scenarios (apparently caused by allowing so many unprocessed events to accumulate in the first timestep, with the bug model, see the prior section). A workaround is to close the Diagnostic Output Window (which now works effectively) -- no information is lost by doing this. The slow execution state can also be fixed by clearing all diagnostics messages or turning off informational diagnostics -- both of which can be done while the model is running.
Message records are no longer immediately added to the DiagMsgDataModel (a QAbstractTableModel implementation). They are queued up and periodically added to the model in batches using a QTimer. See especially the following data structure and these methods. (See the relevant object diagram later in this document).
// Queued Message Records
QList<DiagMsgDataModel::Rec> DiagOutputWidget::_queuedMessageRecs;void DiagOutputWidget::appendMsg (cwDiagData* diagData);
void DiagOutputWidget::schedMessageDelay (int msec);
void DiagOutputWidget::releaseQueuedMessages();void DiagMsgDataModel::appendRecords (
const QList<Rec>& msgRecs, // Messages to be added
const QWidget* refWid, // Reference Wid for font measurements
int& shownRowCnt, // Ret: number of new shown rows
QList<int>& hiddenRowList, // Ret: new hidden rows
QSet<cwDiagLevel>& levelSet); // Ret: messages' levels
Since QStrings use "implicit sharing" (with "copy-on-write"), and since the "context" or "message" part of many diagnostics messages are often duplicates of those parts in prior messages, significant memory savings can be achieved by insuring that, to a large extent, identical strings in these two lists are explicitly copied from prior instances. This reduces the amount of dynamic memory allocated for the generated diagnostics messages stored in the model class.
A simple cache algorithm was introduced which maintains two static arrays of QStrings indexed by the number of characters in the string. Each element contains the last "context" or "message" string encountered of the respective character length. The cache is applied to new diagnostics messages as they are generated.
enum { CtxCacheCharLimit = 250 };
enum { MsgCacheCharLimit = 750 };
static QString _ctxStringCache [CtxCacheCharLimit];
static QString _msgStringCache [MsgCacheCharLimit];
When a match is encountered, the cache's copy is assigned to the new message's row record (DiagMsgDataModel::Rec). This isn't a perfect cache algorithm (not all potential duplicates are "shared"), but it is very efficient and highly effective. In the test model (in the course of processing 350,700 diagnostic messages), the following savings are realized:
| Context Strings: | 321,411 cache hits | 92% savings |
| Message Strings: | 204,604 cache hits | 58% savings |
See the DiagMsgDataModel::Rec::applyStringCache() method, called from the Rec (DiagMsgDataModel::Rec) constructor.
The Diagnostics Output Window supports a Filtering function applied to diagnostics messages which have already been generated. This is distinct from the message-generation "filtering" controlled from the Diagnostics Configuration Dialogs. Messages which are filtered out in the Diagnostics Output Window are not removed -- they are only temporarily hidden, so can be shown again by clearing or changing the filter specification.
The "Model" (DiagMsgDataModel) is a more appropriate place for the filter specification (data) and algorithms for a bunch of reasons. It was done in the course of this bug fix because we were thinking of completely deleting the DiagOutputWidget (and its two QTreeViews) when the Diagnostics Output Window (or the analogous panel in the SCT) are not visible. It turned out that closing the containing window had the desirable effect. (The DiagOutputWidget is removed from all instantiated widget parents). So it was not necessary to actually delete the DiagOutputWidget when the diagnostics messages are not shown.
A future possible enhancement (for which this change would be helpful) is a re-implementation of diagnostics message filtering. Currently filtered-out message rows are hidden by hiding those rows within the QTreeView. This is quite inefficient when a large number of rows are hidden. Filtering changes take a lot of time because changing the hide-state of a row is very inefficient in a huge list where a lot of rows are currently hidden. A more efficient implementation would be having the visible model (DiagMsgDataModel) provide only the non-filtered rows when filtering is active.
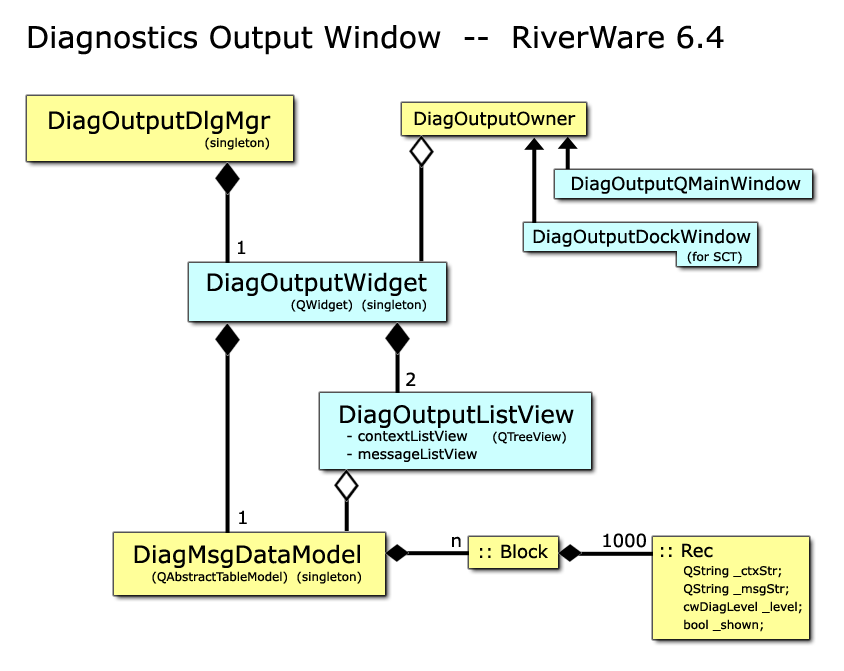
This object diagram for RiverWare 6.4 is also correct for RiverWare 6.5. We had considered moving the DiagMsgDataModel from the DiagOutputWidget to the DiagOutputManager (all singletons) so that the DiagOutputWidget and its two QTreeViews could be deleted when the diagnostics message display is not shown. But that turned out to be unnecessary. Closing (and deleting) the DiagOutputWidget's parent dialog (while keeping the DiagOutputWidget instantated, stored in the manager class) was sufficient for preventing the worst part of the Gnats 5405 performance problems.
--- (end) ---