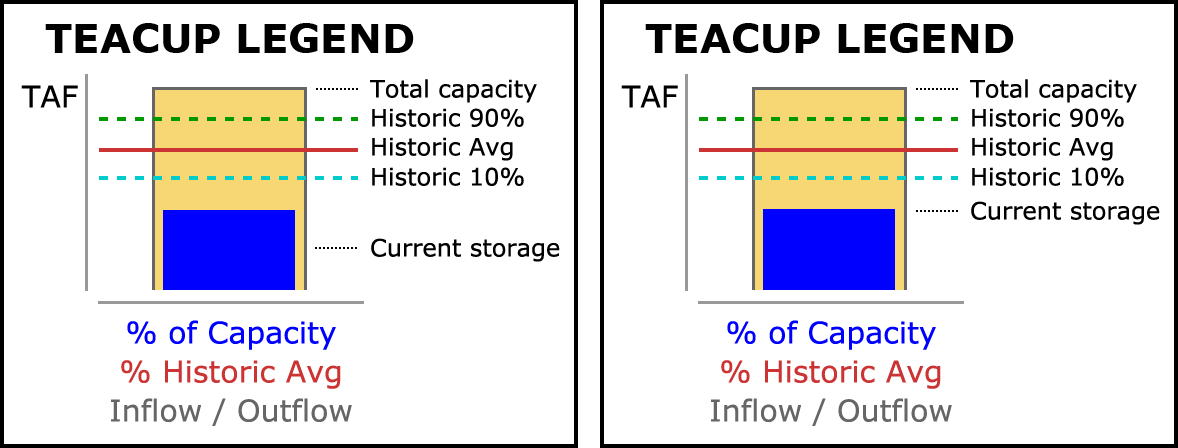
- It is nice to be able to tuck all Text Items and Images under top-level tree items. Otherwise they will be overly dominant over the Teacup Groups and Flow Line Groups (of which there will be relatively few -- typically just one).
- For Text Groups, this was a good way to assign a common Font to a bunch of text items. (The prior design had a more complicated approach). The alternative of allowing every Teacup instance to have its own font will mostly be a headache, and will require implementation of a manager dialog for text items.
- It was nice to have a way of temporarily turning off a group of graphics objects. (Each of the four types of Groups has a "Show" checkbox). Users may appreciate this, and it will be useful when debugging graphics rendering.
- I may want to keep this in the architecture, but initially support only a single instance of each of these two groups, just called "Text Items" and "Images".
David and I agreed to these provisions:
- We'll retain the group architecture for all four types of objects. Instances of all four groups will be individual hidable. Text Groups will have a configurable font.
- We will support only a single Image group. Adding an Image will automatically create that group which will just be presented as "Images" as a top-level tree item in the object tree.
- Adding a Text Item will automatically create the first Text Group if none is already created.
- I'm using only LINE THICKNESS to show flow magnitudes relative to all flows in the group, and COLOR and PATTERN to show flows relative to the CHANNEL CAPCITY (i.e. of each flow line instance). (I think this is well described in the document). E.g. lines get angry looking (bright red, dashed) when banks are overflowing. For the latter, the enumeration of, and display attributes of each "Flow Interval" is defined at the Group level, and Thresholds at the instance level. We could come up with a Flow Line Color and Pattern Legend design.
These changes seem fine. The markups also suggest elimination of the ability to hide the configuration panels. I'll remove that as well.
- I think that users will really want these values to be "Percent", even though a percent capability is provided as a global (Unit Scheme based) option (unit) of the "Fraction" unit type.
- I have a general concern that the numeric precision (number of fractional digits) which is appropriate for value display in RiverWare (generally in tables and lists) will not be appropriate for this particular graphical display. (This came up before with Plot Axis values). The Output Canvas' emphasis is more about approximate and relative values than about precision.
- However, we can initially go with a pure Unit Scheme approach to numeric display. (A possible option to consider in the future is associated a designated Unit Scheme with the Output Canvas; this approach was considered, but was not ultimately used, for DMI unit specifications).
