| A |
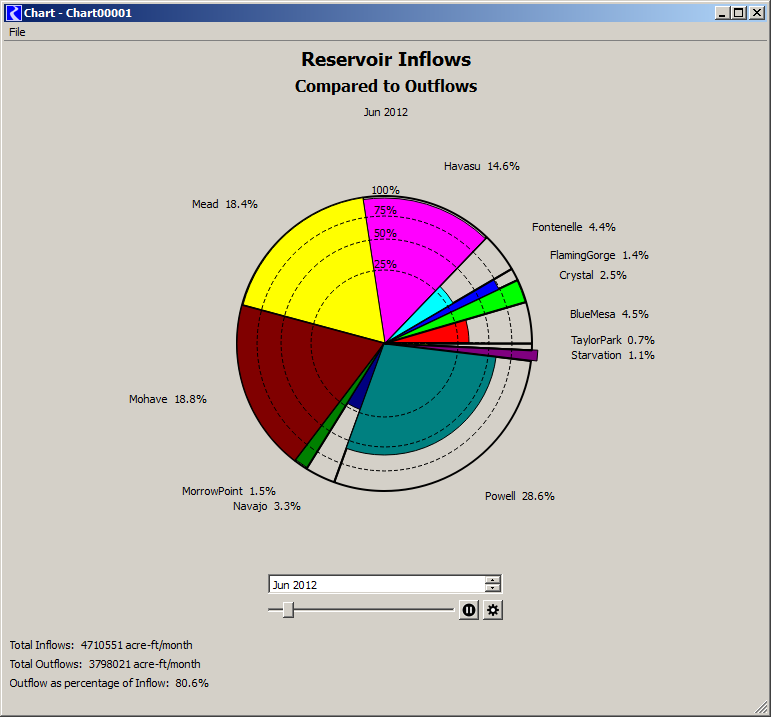
When resizing Pie Chart plot window, the pie chart image becomes non-centered. |
| 4-21-2014 |
Although some geometry improvements had previously been applied,
this problem still existed. The Pie Chart widget has the full
width of the window, so this wasn't a widget-centering problem. The drawing of the pie
image within the widget needed to be re-centered, and that might have been quite
complicated, as the
geometry computation algorithm uses a sequence of iterations to get the pie chart
and all of the slice labels fitted onto the available area, while maximizing use
of that area. The centering correction was implemented without messing with those
geometry computations -- on the final iteration where drawing actually occurs,
a QTransform is applied to the QPainter to shift the drawing to the center
(based on a computed "extra width" and "extra height" values). |
| B |
After resizing Pie Chart plot window and trying to change the date spinner, the pie chart window snaps back to original window size before allowing date to be changed. |
| 4-18-2014 |
This was solved by doing a custom 'adjustSize' operation from ChartDlg::updateChartData(). The width and height of the dialog are only grown to the new sizeHint() instead of fitted. |
| C |
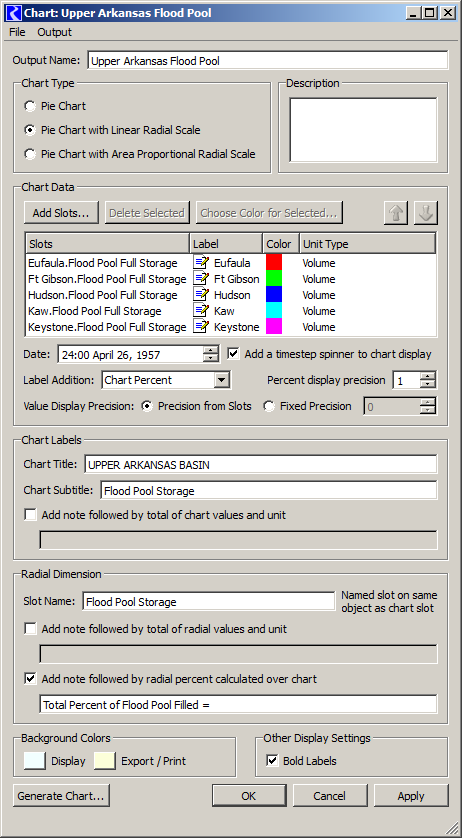
Add animation functionality. |
| 4-21-2014 |
A new "add-on" widget to any DateTime spinner (DateTimeSpinSlider) was developed which provides a horizontal slider -- with the same range as that of the DateTime spinner -- and buttons which support animation -- periodically stepping the slider and DateTime spinner one timestep, with a configurable frequency. The slider can be operated manually, or automatically advanced (repeatedly) by clicking the "Play" icon button; clicking again pauses the animation. See commit record. See screenshots:
A few "media" (-play) button images have been added to the RiverWare icon repository. See these resources:
|
| D |
Options to change graph background color. |
| 4-21-2014 |
The configuration now supports seperate background colors for Display and for Export/Print.
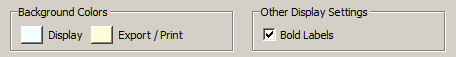
... see full dialog.
This configuration dialog was already getting pretty tall, and this makes it even taller. |
| E |
If you export the graphs, the gray background becomes part of the image, which doesn't work very well for printing or converting to pdf. The gray background may be preferred for viewing onscreen, but there needs to be a way to turn it off for exporting or printing the image. |
| DONE |
This had been addressed in the course of adding Pie Charts to RiverWare Model Reports. (See this commit on 11-18-2013 for RiverWare 6.5) -- export and print background was made to be white. But now, in the course of addressing the prior item, the background color for image export and printing is now configurable. |
| F |
Bold fonts for the date, radial labels, and footers would help make them more visible and create a better export image. |
| 4-21-2014 |
The configuration supports a single "Bold Labels" toggle for all regular text labels (e.g. this doesn't effect the larger Title and Subtitle text). See the image above, in Item "D". |
| G |
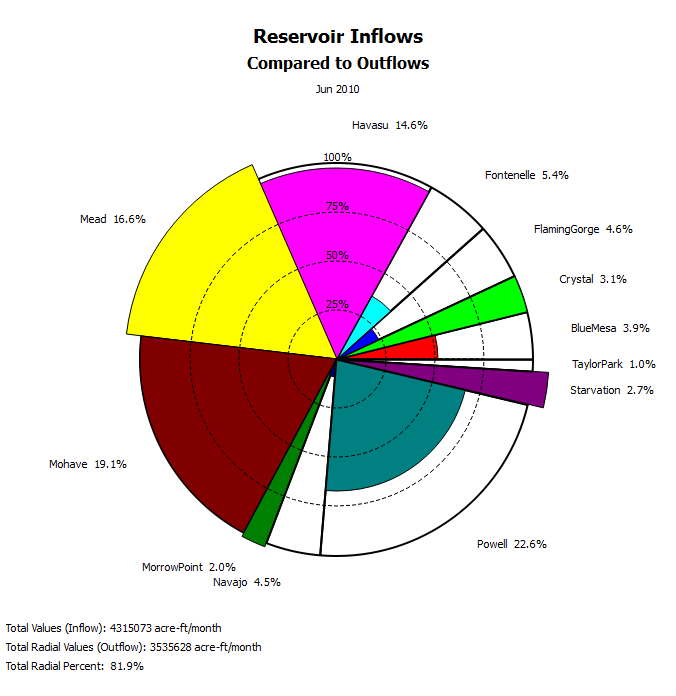
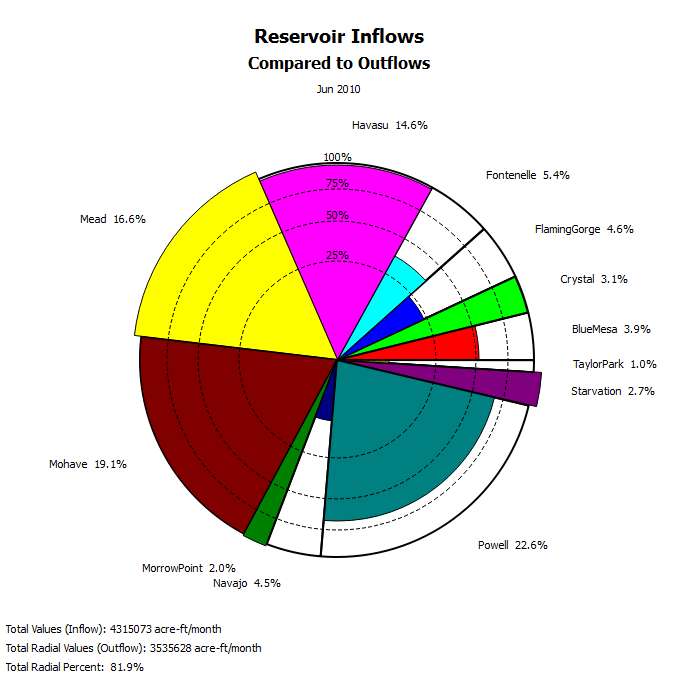
The 25%, 50%, and 75% circles should be dashed lines and maybe a lighter shade than the other lines in the graph. |
| 4-18-2014 |
The radial scale circles were actually already a little lighter, but now they are dashed. This is just done unconditionally (i.e. not as an option). See two examples:
|