COE SWD 9: Editing Multiple Curves and Plots / RW 7.1 / Dev Status
Phil, 3-16-2017 -- HIT REFRESH -- See also Project webpage.
Reported Hours (89.25 of 88 hour budget) (1.25 hours over budget):
- 2.0 Hours -- Fri, 2-17
- 8.0 Hours -- Mon, 2-20 ... img1, img2, img3
- 8.0 Hours -- Tue, 2-21 ... ctrl panel / other images
- 8.0 Hours -- Wed, 2-22 ... img
- 8.0 Hours -- Thu, 2-23 ... img1, img2, img3
- 8.0 Hours -- Fri, 2-24 ... img
- 8.0 Hours -- Mon, 2-27
- 8.0 Hours -- Tue, 2-28 ... img
- 6.0 Hours -- Wed, 3-01
- 8.0 Hours -- Thu, 3-02 ... edOrn, icons, repl1, repl2, repl3
- 2.0 Hours -- Fri, 3-03 ... project review and testing; found MarkerDlg crash due to recent related development.
- 5.0 Hours -- Wed, 3-08 ... Dialog changes; solved exit assertion failure; dialog positioning.
- 1.25 Hours -- Mon, 3-13 ... Don't sumiltaniously show Plot Viewer and Multiple Plot Editor dialog.
- 6.0 Hours -- Tue, 3-14 ... adjustments and feature document.
- 3.0 Hours -- Wed, 3-15 ... edits to document, rebase and merge to RiverWare 7.1 master branch.
GIT Branches:
Feature Document (3-15-2017):
- USACE SWD 9: Editing Multiple Curves and Plots / RW 7.1 / Feature
- R:\doc\plotting\2017\CoeSwd9-EditMultiPlotsCurves-Feature.docx
- PDF: http://cadswes2.colorado.edu/~philw/2017/CoeSwd9/CoeSwd9-EditMultiPlotsCurves-Feature.pdf
- HTML: http://cadswes2.colorado.edu/~philw/2017/CoeSwd9/CoeSwd9-EditMultiPlotsCurves-Feature.html
- Images dir: http://cadswes2.colorado.edu/~philw/2017/CoeSwd9/DocImages/
Maintenance -- TODO:
- [3-16]: I'm noticing that the QString PlotItemTreeView::PlotItem::itemHashStr() implementation is insufficient. (This is used just to restore the plot item selection when the internal QTreeView model is rebuilt). The arbitrary hash string result needs more information for plot ('p') plot item types. Currently, only its support for slot curve ('s') and marker ('m') plot items is sufficient.
Deferred Feature List of 3-2-2017:
- Provisionally Completed 3-2-2017:
- Marker Support - Line Style, Symbol, Label config only
- Icons in the Plot Item Tree View (slot, plot position).
- Indication (a green border) for editable cells.
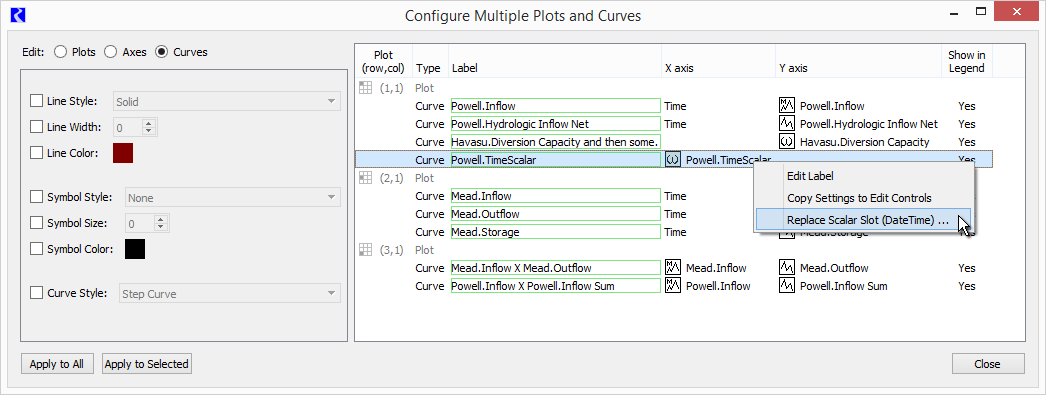
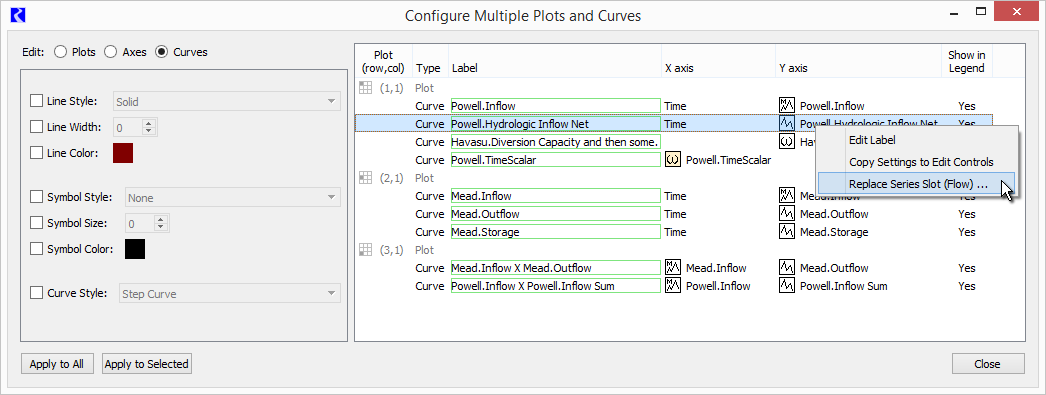
- Single slot curve slot reassignment via GUS. (implementation has some limitations). See #13, #14 below.
- "Show in Legend" flag (checkbox) for individual Curves (and Markers). (Include this in design for COE-SWD 10)
- Moving curves and markers up or down within a plot. (Include this in design for COE-SWD 10)
- Marker Support - Other marker settings (type, alignment, x position, y position)
- Moving plots within the PlotPage's 3x3 grid.
- Delete Plots, Curves, Markers.
- Remove Plot (Curve) Membership dialog (given sufficient new provisions).
- Remove Marker Manager dialog (given sufficient new provisions).
- "Sample" column for Curve appearance settings.
- Additional items left over from #4, above (Single slot curve reassignment via GUS):
- Add GUS support for AggSeriesSlot and TableSeriesSlot columns.
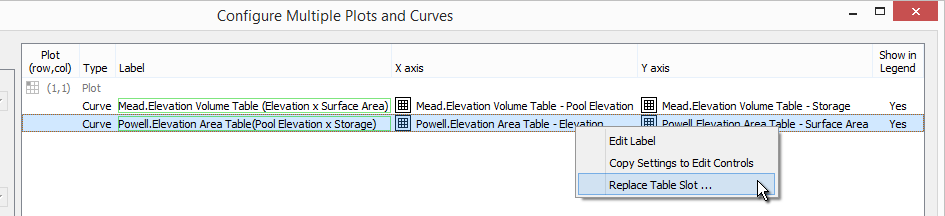
- For Table Slot Curves, pop up a small dialog to allow specification of which Table Slot columns for the X and Y dimensions.
- Large issue: Values for Markers do not have associated units, either at the Sim level (MarkerInfo in Sim/PlotInfo), nor at the GUI level (Q3GUI/PlotMarker). So, they fundamentally can't behave well through axis unit changes. We could consider supporting this "properly" only for a new Dynamic Marker capability where the one or two values for a Marker are identified with references to Scalar Slots. The assignment of Dynamic Markers to plot axis would use the algorithm applied to curves -- based on the unit types of the one or two referenced slots -- rather than being hard-configured to particular horizontal and/or vertical axes.
Relevant Filed Bug (pre-existing problem):
Completed Wednesday (3-8):
- Minor dialog changes, responses to comments at 3-7 software meeting:
- Moved "Apply" buttons into the plot editor control panel (different UI source file).
- Added visible note about double-clicking items to set the edit controls.
- Addressed an assertion failure on "clear workspace".
- Addressed initial dialog position problem.
Completed Sunday (3-5):
- Implemented incell editing for Marker values -- both DateTime and numeric values.
- Width fixes:
- The PlotEditControlPanel (setting widgets) panel is no longer strangely wide.
- The initial dialog width is now optimal.
- Context menu operation: Copy Slots (to slot clipboard).
Completed Thursday (3-2):
- Marker Support for attributes common to Slot Curves (six settings related to line and symbol appearance, and label editing). (Note that marker value editing is not yet supported).
- Icons in the plot item table (QTreeView) for: (a) Plots, (b) Slots.
- Indication (a green border) for editable cells. This was applied to only "directly" editable cells, which is limited to the LABEL column.
- Single slot curve slot reassignment via GUS. (Some limitations).
Completed Wednesday (3-1):
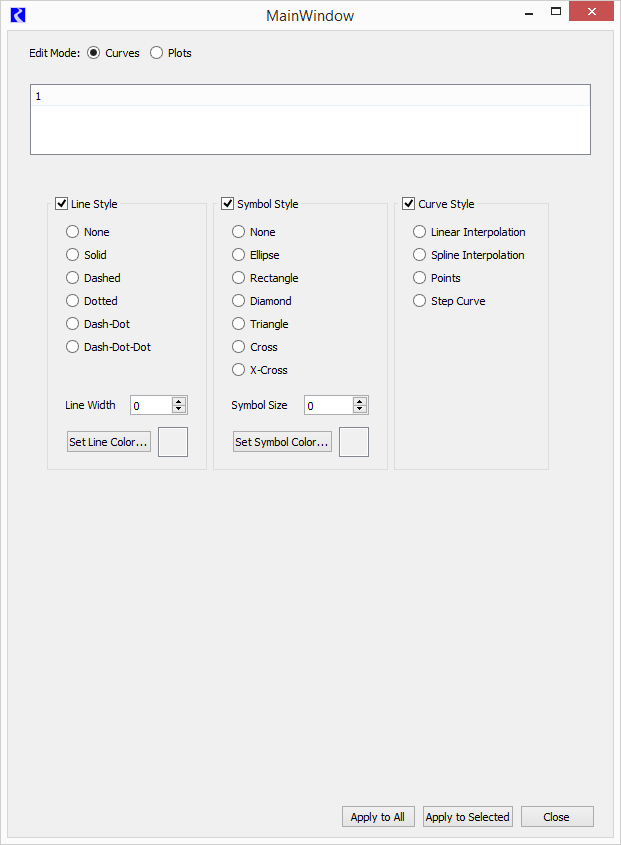
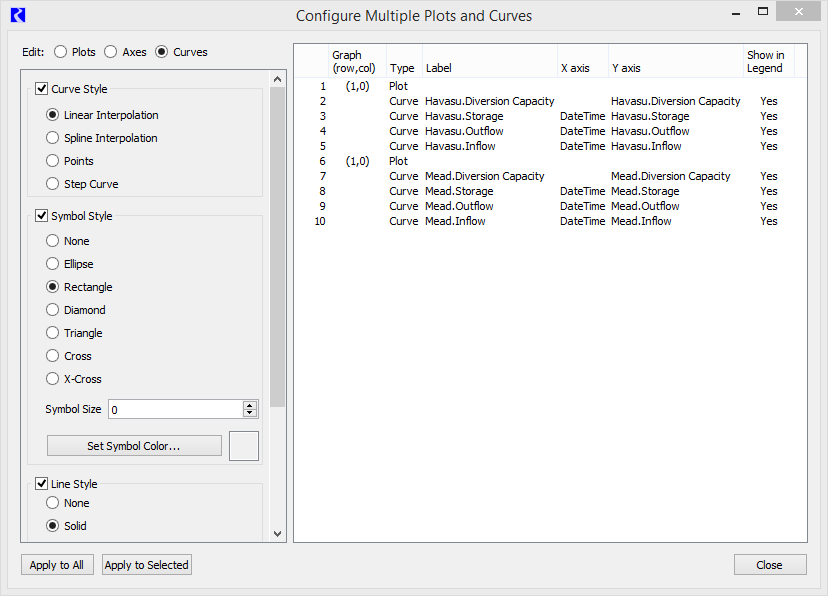
- Curve setting controls: Redesign -- more compact -- and finer granularity.
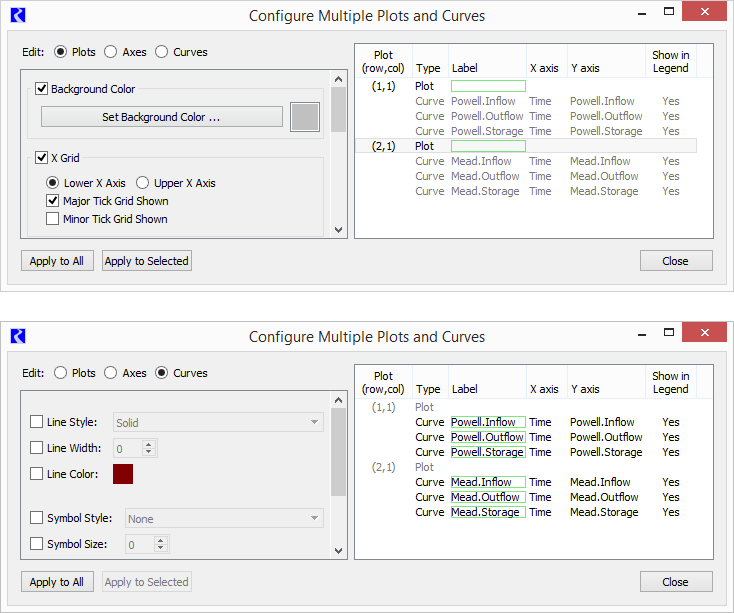
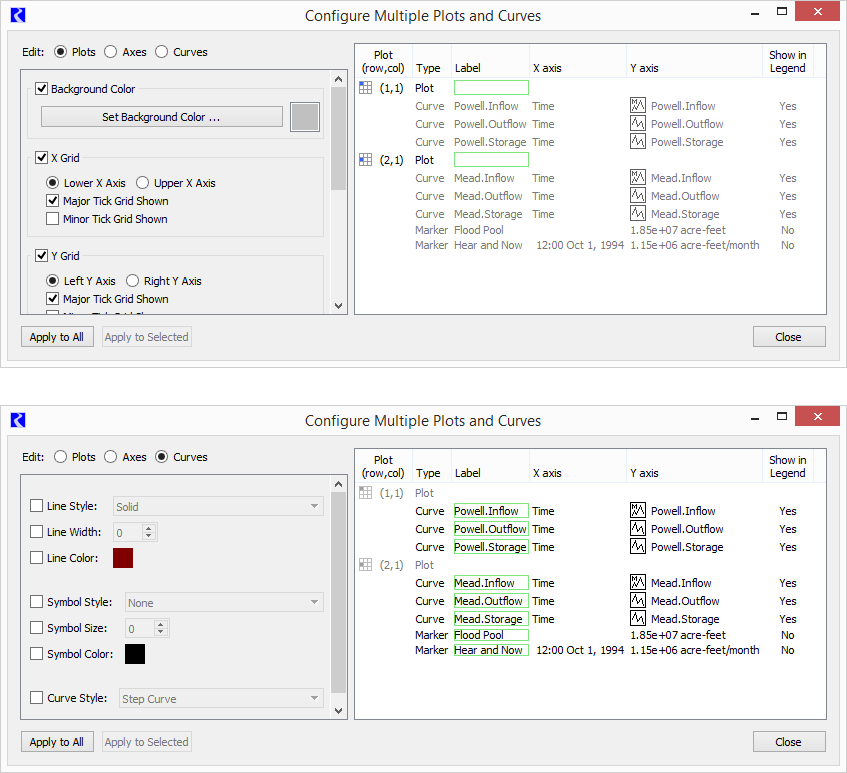
The individual seven (7) curve properties can now be independently enabled for application to the selected (or "all") slot curves in the plot page being edited. Also, the radio boxes for the three different relevant styles (line style, symbol style, and curve style) have been replaced with comboboxes. See the prior and new screenshots:
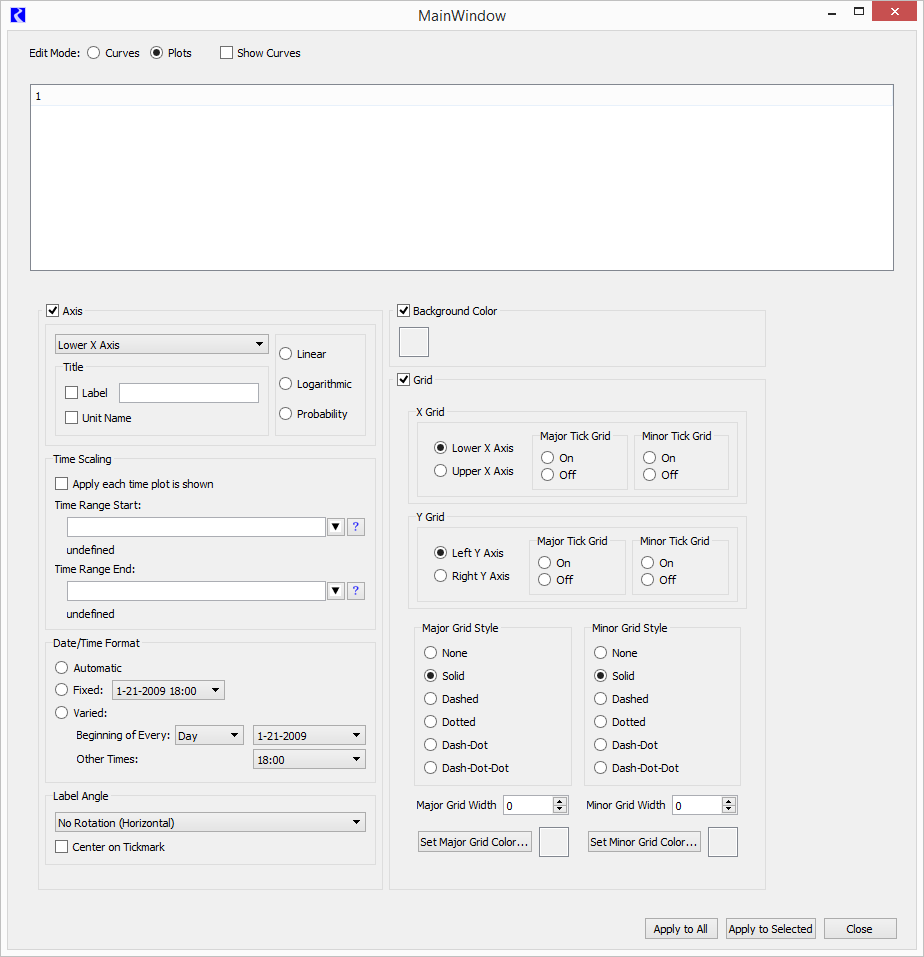
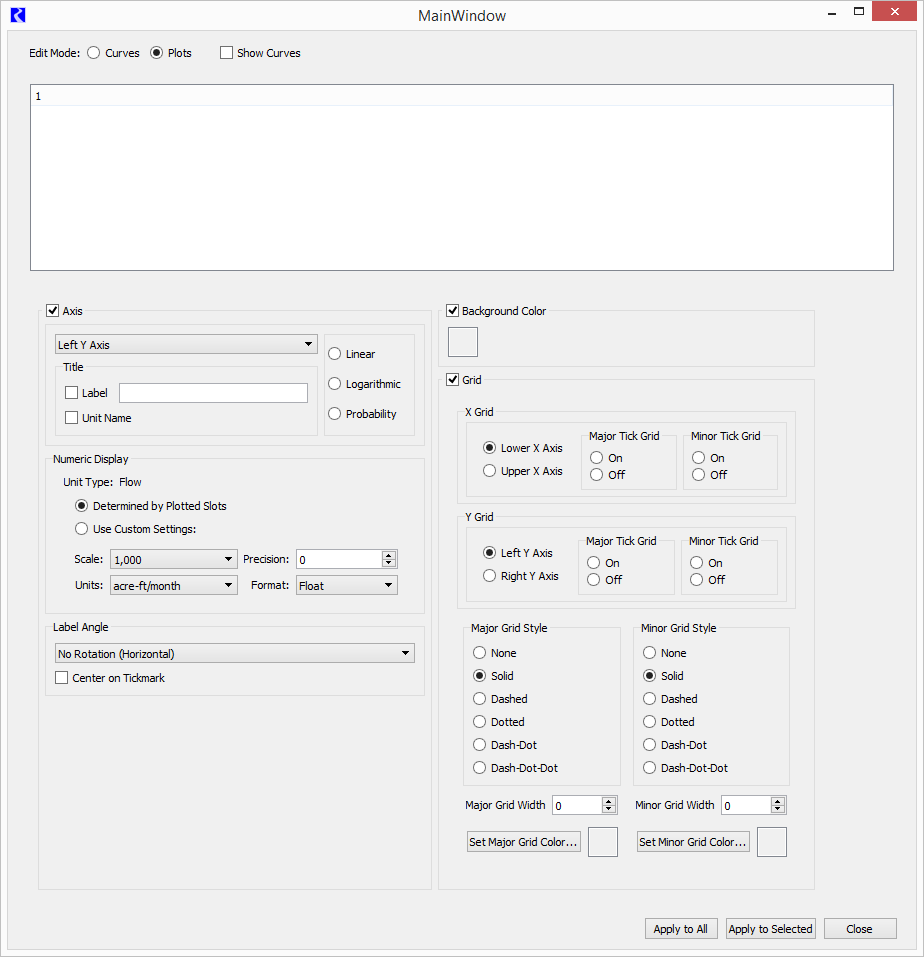
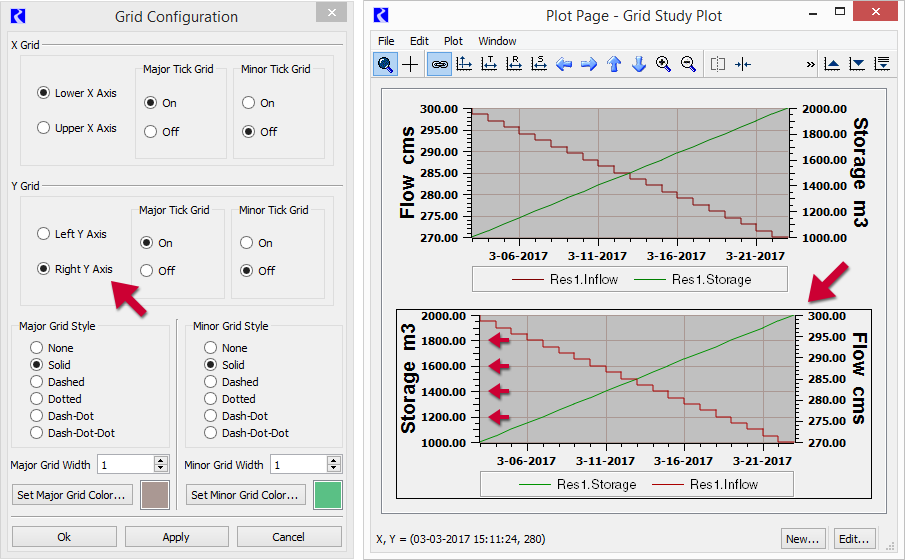
- Grid setting controls: Redesign -- more compact -- (but still same granularity)
The same new compacted design for curve line attributes has been applied to the Major Grid and Minor Grid line attributes (on the Edit "Plots" mode). This includes replacing the line style radio buttons with comboboxes. See the prior and new screenshots:
Also, the plot item "ordinal" column was hidden, and centering has been applied to the two-line column headers. (These last changes are reflected in _both_ of the screenshots cited above).
Completed Monday (2-27) and Tuesday (2-28):
- Internal setting widget enabledness and visibility dependencies.
- Initial completion of Plot and Axis setting operations. (Curve setting ops were provisionally completed on Friday).
- Updating of PlotItemTreeView items when the collection of Plots within a PlotPage changes AND when the collection of SlotCurves within a Plot changes. (Previously, only a low-level Plot and Curve "safety" had been implemented. Pointers were being cleared when those objects are deleted. The display fields depending on those objects go blank).
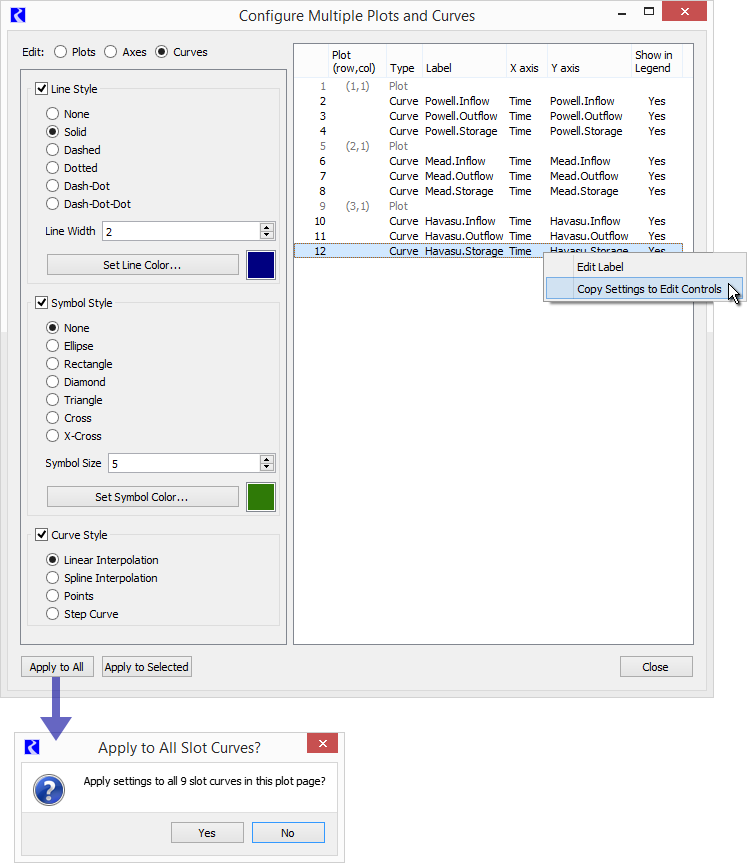
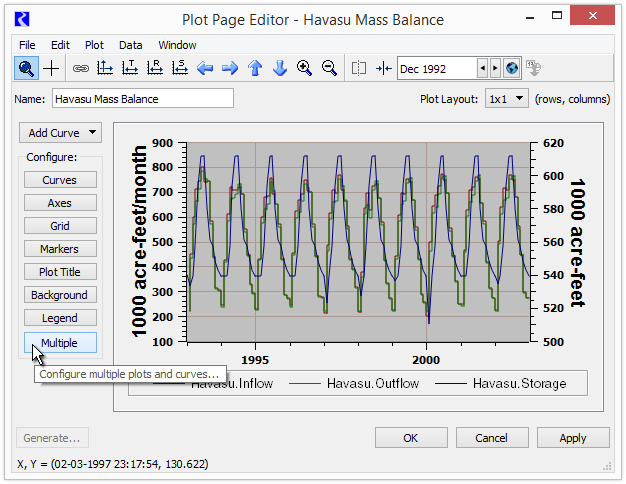
- Plot Page Editor dialog: Add "Multiple..." button to the "Configure" button panel. This shows the new "Configure Multiple Plots and Curves" dialog. (Currently, this is doable only from a menu item under "Edit").
- Asynchronous updates in other dialogs when applying changes in the new multiple-plot configuration dialog. (A reasonable level of coverage).
Original project materials:
---