USACE SWD 9: Editing Multiple Curves and Plots / RW 7.1 / Feature
Document Home: R:\doc\plotting\2017\CoeSwd9-EditMultiPlotsCurves-Feature.docx
Phil Weinstein, David Neumann, Edie Zagona, CADSWES -- 3-14-2017, minor edits: 3-15-2017.
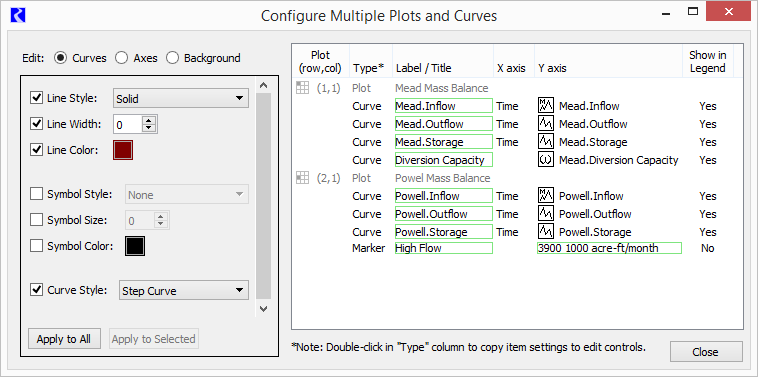
RiverWare 7.1 provides an enhancement to plot page configuration which centralizes editing controls from various single-item editor dialogs into a unified multiple-item editor. Most settings for a plot page's supported nine separate plots are editable within the new Configure Multiple Plots and Curves dialog. The user can select multiple items in a plot page, e.g. curves and markers, and apply selected settings to those items in a single operation.
The Configure Multiple Plots and Curves Dialog supports three editing modes.
The choice of editing mode determines:
Groups of related settings -- or, in some cases, individual settings (as for the "Curves" settings illustrated above) within the vertically scrollable editing controls panel can be individually enabled for application to the selected (or all relevant) items within the plot item table.
Apart from the setting operations supported in the editing controls panel, operations within the plot item list include:
This initial implementation of the Configure Multiple Plots and Curves Dialog does not support the following capabilities:
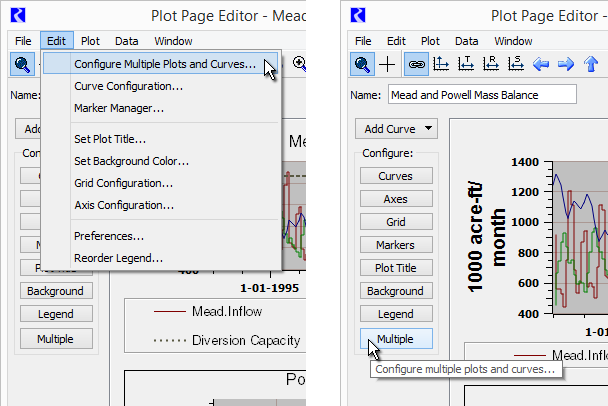
The new Configure Multiple Plots and Curves Dialog is accessible from the Plot Page Editor dialog via an "Edit" menu operation, and via a new "Multiple" configuration button. See the following screenshots.
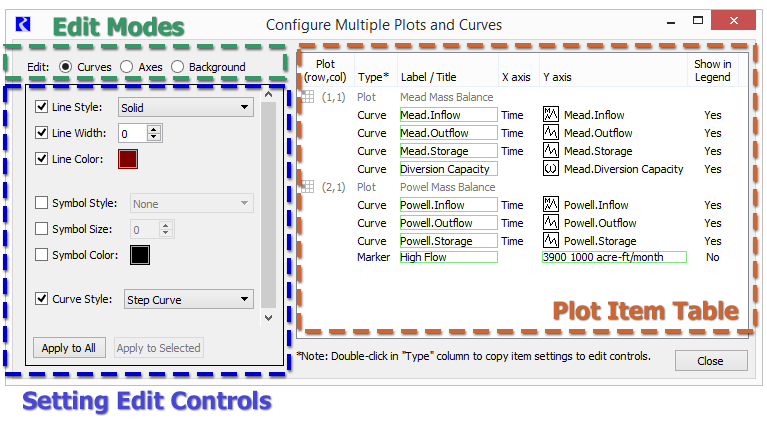
This dialog has three major panels:
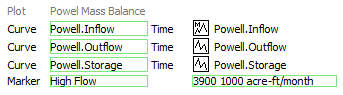
Directly editable cells within the plot item table are indicated with a green border. Double clicking on such cells starts an in-cell edit:
Edit operations -- either direct edits within the Plot Item Table OR setting changes applied when clicking the "Apply to All" or "Apply to Selected" buttons in the Setting Edit Controls panel -- are applied to the plot page being edited in the Plot Editor Dialog. In that dialog, the user can either accept ("OK" or "Apply") those changes, or can discard ("Cancel") those changes.
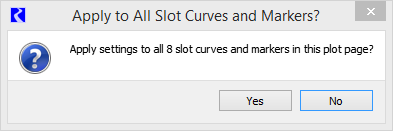
Clicking the "Apply to All" button shows a confirmation dialog; see the following example.
In "Curves" edit mode, the curve and marker items within the plot item table are active. Double clicking on an item either starts an in-cell edit within the clicked cell or copies that curve's or marker's setting values to the edit controls panel. Curves' and markers' label text and markers' values can be directly edited.
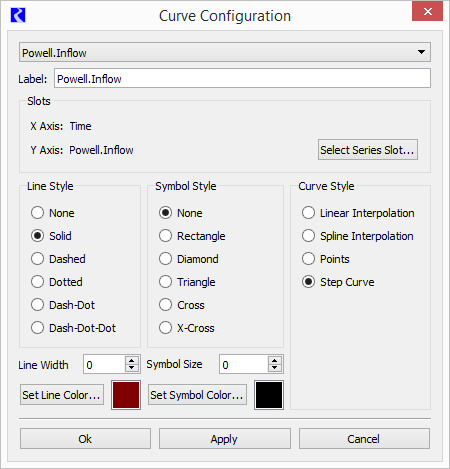 |
All of the setting operations provided in the old Curve Configuration dialog (shown to the right) are supported in the new Configure Multiple Plots and Curves Dialog.
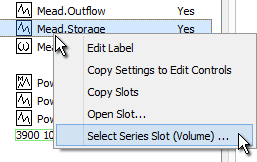
Various operations on curves and markers are supported with a context (right-click) menu:
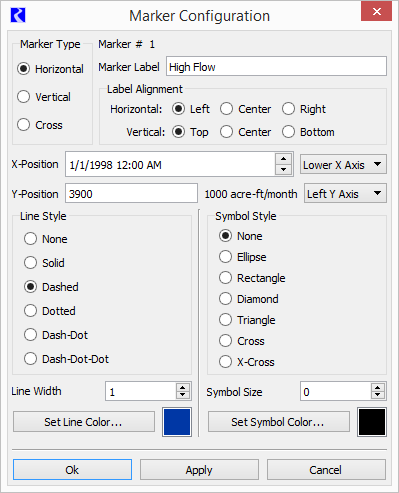 |
Current support for marker editing is limited to the settings which are also available for curves. This includes all setting operations provided by the old Marker Configuration dialog (shown to the right) and the Plot Marker Manager except for the following:
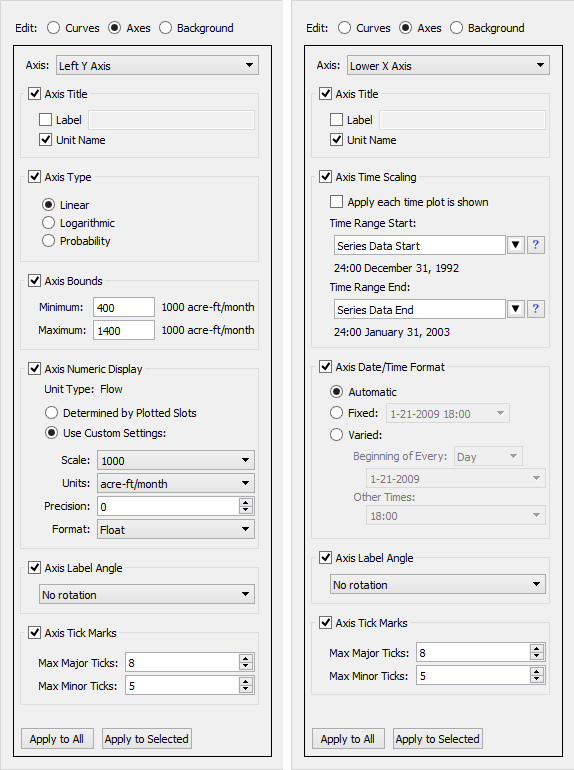 |
In the "Axes" edit mode, the plot items (not curve and marker items) within the Plot Item Table are enabled for selection.
The user also selects which of the four axes is to be modified among the selected plots (or all plots in the plot page) -- see the combo box at the top of the Setting Edit Controls panel.
Only those settings appropriate for the selected axis are presented. (DateTime axes support different settings).
All setting operations supported in the old Axis Configuration dialog (not shown) are supported in the new Configure Multiple Plots and Curves dialog.
Note that the first image to the right presents the recently developed capability (for RiverWare 7.1) for support of user specified scale and units for a numeric axis. See the "Axis Numeric Display" setting group.
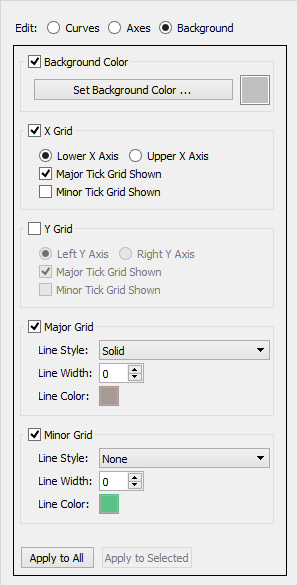 |
As with the "Axes" edit mode (see above), in the "Background" edit mode, the plot items (not curve and marker items) within the Plot Item Table are enabled for selection. Changes to plot background color and grid configuration can be applied to the selected plots -- or to all plots in the plot page.
All setting operations supported in the old Grid Configuration dialog (see below) are supported in the new Configure Multiple Plots and Curves dialog.
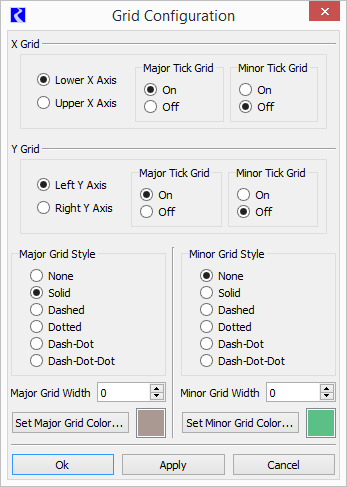
Note: During this development, a previously existing defect was discovered which prevented the grid from being aligned with the "other" axis in each dimension (i.e. the Right Y Axis or the Upper X Axis). This has been fixed for RiverWare 7.0.6 and 7.1 development. See Gnats 5923, "Alignment of plot grid with right axis is not working."
--- (end) ---