USACE SWD Task 6: Plotting: User Defined Axis Units,
for RiverWare 7.1
Phil Weinstein, David Neumann, Edie Zagona, CADSWES, 2-12-2017 (c)
R:\doc\plotting\2017\CoeSwd6-UserPlotAxisUnits.docx
Plots in RiverWare 7.0 and prior versions have the following related limitations.
The following new provisions have been added for RiverWare 7.1 to address those limitations.
Additionally, the following capabilities which had effectively been lost in RiverWare 7.0 with the plot dialog redesign (separate editor and viewer dialogs, and the elimination of the old plot page configuration dialog) have been added to plot dialogs.
The Paste Slots operation is available only in Plot Page Editor dialogs. The Copy Slots operation is available also in Plot Page Viewer dialogs.
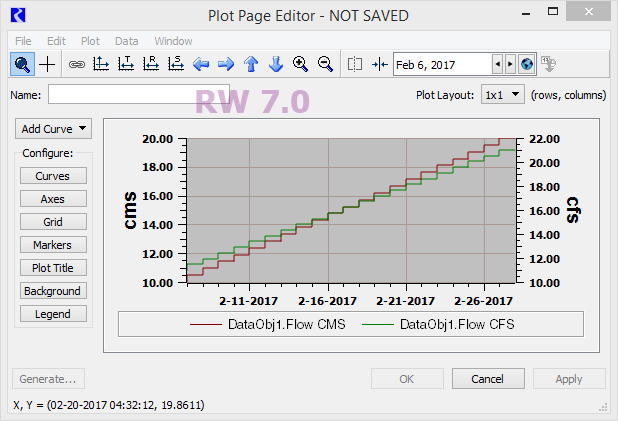
The following screenshot from RiverWare 7.0 illustrates how slots having the same unit type (flow) but different units (cms and cfs) are plotted along different axes. Notice that the axis scales are unrelated. (This is apparent, given the fact that cms and cfs are different by a factor of about 35).
The following screenshot illustrates the plot axis unit type association of the revised implementation. Both the "cms" and "cfs" slots are plotted along the left axis, as they are both of the same unit type (flow). This axis has units of "cms" because those are the units of the first slot associated with that axis. The right axis is available for slots of a different unit type (e.g. volume).
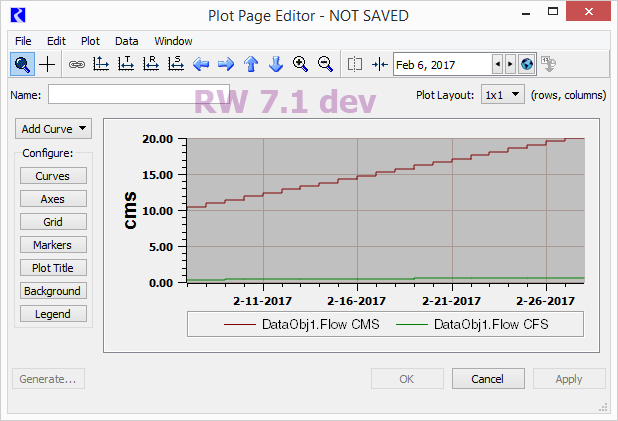
The axes / unit type association is established automatically as slot curves are added to a plot. It is not possible to manually set an axes' unit type, nor to manually move an axis to the opposite side of the plot.
Axis scaled units in the slot-based axis scale mode are dynamically determined; an axis' scaled units changes when the units of its "first slot" changes.
The Axis Configuration dialog is accessible from the Plot Page Editor dialog, by clicking the (Configure-) "Axes" button (see above), and under the Edit menu ("Axis Configuration...").
 |
|
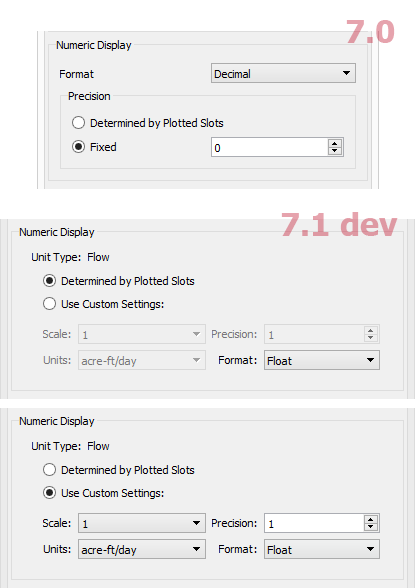
The Numeric Display section of the Axis Configuration dialog has been enhanced to support switching between "Determined by Plotted Slots" and "Use Custom Settings" for the following three properties:
Note that the Format selection is independent of the mode selection. (Notice that the Format controls are enabled regardless of that selection). The supported formats are "Float," "Scientific," and "Scientific / Float" (depending on the value magnitude).
As described in prior sections, the "Determined by Plotted Slots" mode uses the scaled unit from the first slot curve associated with the axis.
The precision value for the "Determined by Plotted Slots" mode is the maximum configured precision value among all of the slots associated with the axis. "Precision" is the number of fractional decimal digits shown for major tick-mark values along the axis. A custom precision value of zero is often desirable.
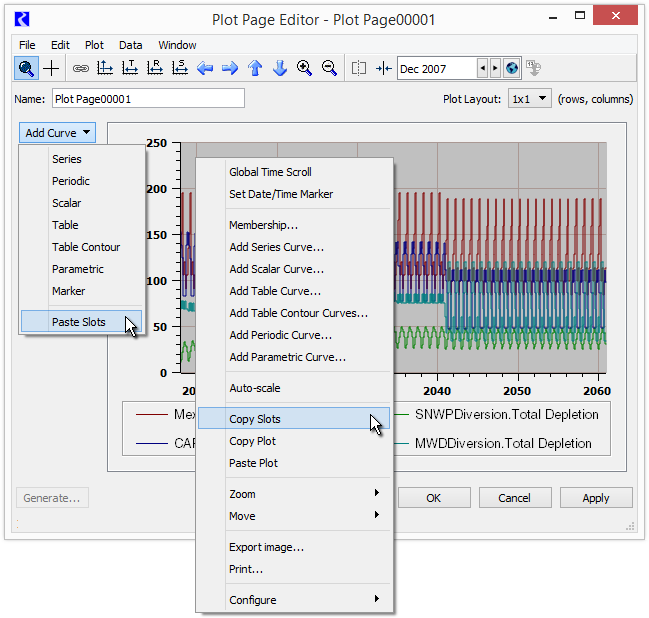
The Paste Slots operation is available as a special item under the "Add Curve" operation pulldown menu in the Plot Page Editor dialog (see below). This attempts to add slot references from the slot clipboard to the plot. An error dialog is shown for each such slot having units which are incompatible with the units of the plot's axes.
The Copy Slots operation is available as a context (right-click) menu in the plot graph panel. This copies the plot's slots (slot references) to the slot clipboard, and the names of those slots to the system clipboard.
Note: A distinction not often made when talking about slots in plots, and also in the slot clipboard, is that these are references to slots "living" elsewhere (generally on simulation objects and accounts). Plots and the slot clipboard don't contain their own instances of slots. (The slot clipboard maintains also references to particular columns on slots). Generally, pasting slots from the slot clipboard results in replicating those slot references. An exception to this is pasting slots into a simulation object -- that results in creating cloned copies of the slot clipboard's referenced slots.
RiverWare plots are implemented with the Qwt 6.1.3 plotting library (the most recent release, as of Feb. 2017) which we have built with Qt 5.5.1.
The axis unit association change was fundamentally based on a replacing scaled unit description character strings in two configuration data structures with a new class encapsulating the new axis unit configuration information, AxisUnitInfo (defined in Sim/PlotInfo). The two configuration data structures containing AxisUnitInfo value instances are AxisInfo (Sim/PlotInfo) and SlotPlot::AxisItem (Q3GUI/SlotPlot). AxisUnitInfo is maintained and passed around by value; not as dynamically allocated objects.
An interesting aspect of the assignment of slots to axis -- which hasn't fundamentally changed with this development -- is that the slot/axis association is not preserved. Rather, the algorithm used to associate a slot curve's two axis (X and Y dimensions) is applied every time a live QwtPlot widget is built. (SlotPlot is our subclass of QwtPlot). A series slot requires a unit-type matching vertical axis for its values, and a horizontal axis for absolute time. The left and bottom axes are used first. Table slot and parametric (two-series slot) curves require one vertical axis and one horizontal axis for slot values from two sources (separate table slot columns or series slots).
Even though that slot/axis assignment is performed dynamically each time a SlotPlot widget is created, axis unit configuration information (AxisUnitInfo) is maintained in association with specific axes (excluding absolute time axes). During the slot/axis reassignment process, AxisUnitInfo values are cached in unit type-based maps, and could sort-of technically wind up on different axes. (Basically, that would happen only if loading a PlotPage output device export file into a RiverWare model lacking some of the plot's slots, or with those slots strangely being of a different unit type). See especially SlotPlot::setAxes (SlotCurve*), called from SlotPlot::addSlotCurve (SlotCurve*), and the _savedUnitTypeUnitInfoMapX and _savedUnitTypeUnitInfoMapY maps.
Here is an example of an AxisUnitInfo serialization. This is an XML element within a Tcl-parsed record, all one line in the model file or PlotPage output device export file. It's a record within a PlotInfo/AxisInfo Tcl serialization; potentially one for each axis.
"$plot" axisUnitInfo {yLeft}
{<AxisUnitInfo unitMode="UnitMode_Slots" unitType="Flow"
fixedScale="1000" fixedUnit="acre-feet/month"/>}
--- (end) ---