USACE SWD 10: Design Documenting for Improved Plot Legend and Plot Layer Control
- Phil Weinstein, David Neumann, Edit Zagona, CADSWES, 3-26-2017. Ready for Review.
Many enhancements to the RiverWare plotting system have recently been developed for RiverWare 7.0 and 7.1, and are planned. The following evolving document describes the road map for RiverWare plotting:
Recently developed plotting capabilities include:
This document proposes the following enhancements:
(I) Plot Legend-Related Enhancements:
- General Legend Enhancements:
- Show Legend Items as Checkboxes.
- Custom Legend Implementation.
- Alternative Legend Placement:
- Legend on the top, left, or right.
- Legend within the plot canvas.
- Label curves in the plot (instead of a legend).
- New Legend Item Ordering Operations:
- Drag and drop within the legend. (Requires Custom Legend, A2).
- Configure Multiple Plots and Curves dialog.
- Drag and drop
- Move up and down widgets, operating on a multiple-item selection
- "Show in Legend" -- new curve and marker property
- Supported in the Configure Multiple Plot and Curves dialog.
- Supported in Context Menu on Curves. (Required curve/marker "Hover" state).
- "Layer" -- new curve and marker property, distinct from legend order, set in:
- Configure Multiple Plots and Curves dialog.
- "Layer" context submenu with "Move to Top", "Move Up", "Move Down", and "Move to Bottom" in the Legend Item context menus.
- New Curves and Markers context menus (on the plot) with with "Move to Top", "Move Up", "Move Down", and "Move to Bottom" actions. (Requires "G1" below).
(II) Other Plot Enhancements:
- Markers without lines; only text label and optional symbol.
- Hover highlight and selection of curves and markers.
- Hover highlight with initial application to layering control.
- Selection highlight, with selection state available for various figure configuration operations..
Plots in RiverWare 7.0 and prior versions use Qwt's default legend class, QwtLegend with items for individual curves and markers implemented by QwtLegendLabel. Use of this legend class provides less control over the legend than would a custom implementation made possible by new provisions in Qwt -- see the next section.
The following enhancements could be accomplished using this default legend class.
However, this legend implementation won't support the development of these features:
Qwt 6.1 (we're using Qwt 6.1.3, the latest available version, with Qt 5.5.1) provides two new unrelated legend capabilities. A plot can actually have one of each, but these capabilities do not otherwise complement each other.
|
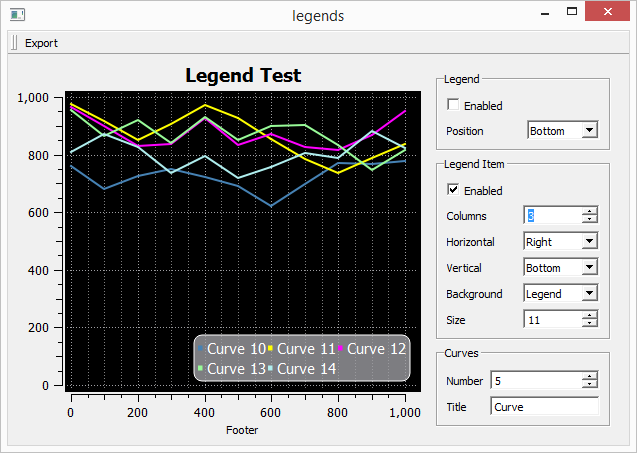
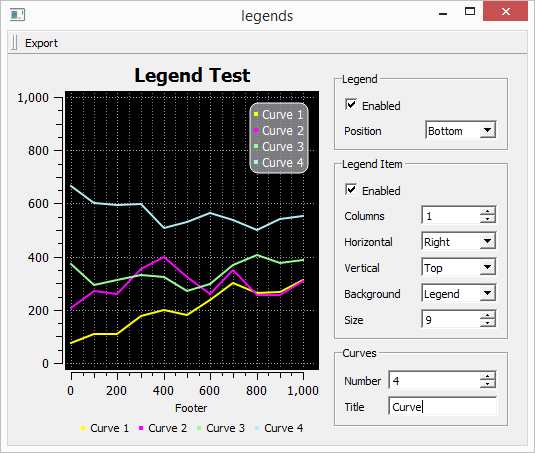
This class directly supports the following settable properties, which could be presented as persistent settings, or just hard-coded values:
- Alignment (corner or side) and "borderDistance" (as mentioned above).
- Number of columns (in an automatic-flow layout). A value of one (1) is demonstrated above. If "unlimited" is specified, the items would be arranged horizontally, in a single row.
- Legend margin, item margin and item spacing.
- Text color ("pen"), border color ("pen"), and background color and pattern ("brush"). Colors can have transparency.
- Alternative option to show each item in its own frame, instead of an overall frame for the legend.
- Border radius (rounded corners).
Use of QwtPlotLegendItem is discussed in section:
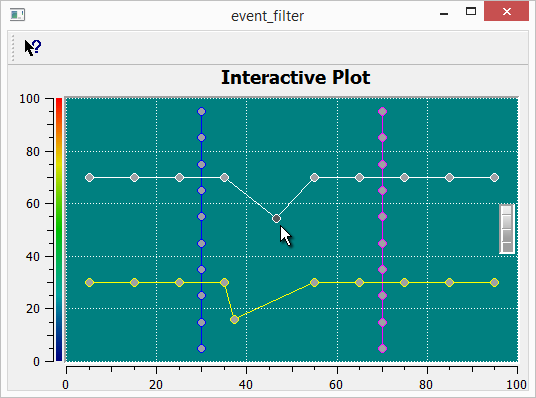
As demonstrated in one of the examples provided with Qwt, some graphical features can be drawn on the plot canvas at the tail end of "paint event" processing. The "Interactive Plot" example (cited in the appendix) does this for one simple ornamentation: the "currently selected" curve point (in that little demonstration program). Such drawn ornaments do not exist as objects; we wouldn't be able to directly implement any mouse interaction with those features.
Implementation of this sort of drawing mechanism would be required for the following features. (See the cited sections, below).
There are some general legend enhancements we would like to provide. These are broken out as those that can be accomplished with the current default legend implementation (using QwtLegend), and those requiring a custom legend implementation (a QwtAbstractLegend custom subclass).
Note: There are two general functional legend enhancements described in this document which don't require reimplementation of the legend using the QAbstractLegend class. See the prior section, "Possible legend enhancements using the current legend class".
An option to show legend items as checkboxes instead of two-state pushbuttons (for showing or hiding the corresponding curve or marker within the plot). The presentation of legend items as checkboxes works particularly well with the legend on the left or right side of the plot, where the items would be presented in a single column.
Development tasks include:
Some of the proposed enhancements require the implementation of a custom legend, as a subclass of QwtAbstractLegend. See the prior section, "New Legend Capabilities in Qwt 6.1". The enhancements include:
A substantial amount of development will be required to implement a custom legend. We'll want to make sure that its functionality is complete and correct with respect to that of the default QwtLegend class. For one thing, the behavior of "wrapping" legend items (e.g. when they appear below the plot) according to the available width of the plot dialog is implemented with a special Qt layout manager provided by Qwt (class QwtDynGridLayout, a direct Qt5 QLayout subclass). During implementation, we will want to examine the source code for the QwtLegend class, which is, itself, a QwtAbstractLegend subclass.
Plots in RiverWare 7.0 and prior versions unconditionally show the legend below the plot. Three distinct alternatives are considered in subsequent sections:
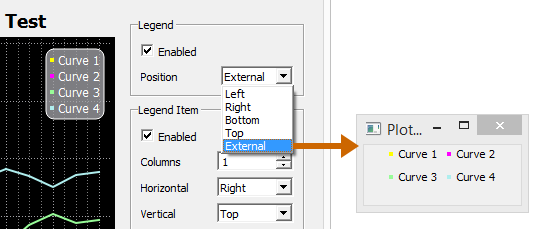
Although the implementations of all three alternatives are quite different -- and technically could be simultaneously shown -- we prefer to show the legend in only one way for a particular plot at any given time. A Plot Legend selector (ComboBox) will be added to the plot configuration with the following items -- depending on what options are actually implemented:
This choice needs to be represented within both the Plot GUI and "PlotInfo" data model (with serialization).
As mentioned above, the Qwt plot legend doesn't have to be below the plot. It can instead be placed on the top or right or left sides. This is an option which could readily be applied to the current legend implementation (directly using the QwtLegend class), or to a new implementation (derived from QwtAbstractLegend). [See the current use of QwtPlot::insertLegend in RiverWare code].
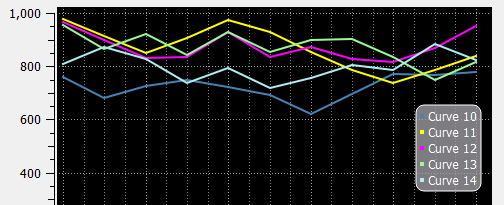
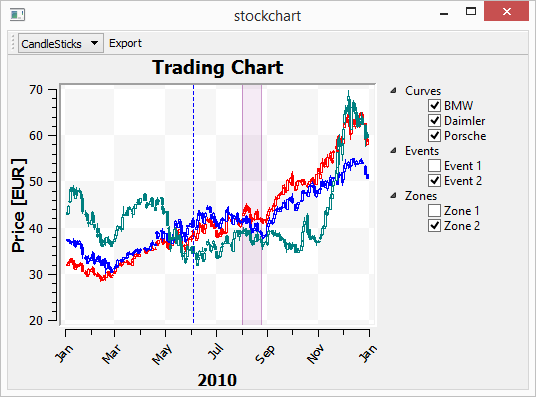
The image below demonstrates placing the legend to the right of the plot, instead of below. This is using Qwt's default legend implementation (class QwtLegend).
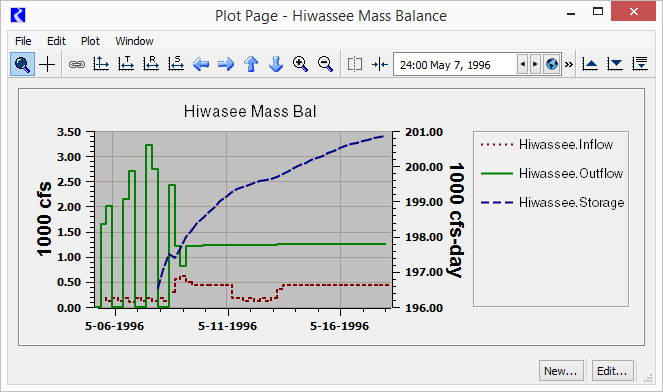
... compare this to the current RiverWare 7.0 support of the legend being shown along the bottom of the plot:
Notes:
Limitation: Display Only; no interaction, with the exception of a context menu.
We can support an option to show the legend within the plot, position in any of the four corners, or centered on any of the four sides. The distance from the sides (in pixels) can also be set.
Legends shown this way will lack these features:
Implementation of the legend context menu on this legend will require some custom coding using an event filter.
Technical Analysis:
As mentioned in the "New Legend Capabilities in Qwt 6.1" summary, it is possible to show a static legend within the plot. (An example of this is available in the Qwt "Legend Demonstration" example, making use of the cited in the appendix). Unfortunately, the relevant class doesn't make available to the application any mouse event notifications. The individual items within the legend do not support a toggle state. The following is from the description of the QwtPlotLegendItem class:
In opposite to QwtLegend, the legend item is not interactive. To identify mouse clicks on a legend item an event filter needs to be installed catching mouse events on the plot canvas. The geometries of the legend items are available using
legendGeometries(). [http://qwt.sourceforge.net/class_qwt_plot_legend_item.html].
So, it would be technically possible to support some interactivity within this in-plot legend, but it would require low-level coding which we are not recommending we pursue, other than possibly for a context menu.
Note that the relevant Qwt terminology is confusing. QwtPlotLegendItem is an "item" in that it is a QwtPlotItem (a thing that lives in the plot canvas, like a curve or marker). It represents the entire legend. But it, itself, has child "item" components -- for the QwtPlotItems (curves and markers) represented within the legend.
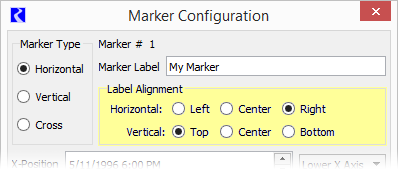
Qwt plot markers (not slot curves) natively support text labels which can be "aligned" (positioned) in the standard nine positions relative to its reference coordinates. (The interpretation of this alignment depends on the marker type: Horizontal, Vertical, or Cross).
 |
It would be difficult, though possible, to show text labels in the plot for slot curves. This would require an unusual provision in Qwt to perform some "extra" painting at the tail end of a paint event, making use of an event filter and the QwtPlotDirectPainter class. The Interactive plot: Event Filter example cited in the appendix shows a simple example of such a mechanism.
We would also need to define and implement a text placement algorithm for the curve text label. This needs to appear on the plot at any zoom level when the curve is visible within the plot. This could have the following provisions for each curve:
Development tasks include:
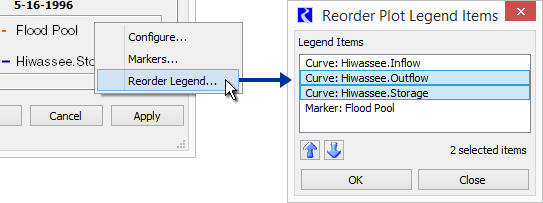
In RiverWare 7.0, legend reordering is done in a separate popup dialog:
 |
Two alternative approaches to reordering legend items are described in subsequent sections:
It doesn't seem to be possible to implement drag-and-drop operations within the current legend implementation (using the default QwtLegend class). We would first need to reimplement the legend by subclassing QwtAbstractLegend. See the following two sections, above:
A drag and drop behavior on legend items would be active only within the Plot Page Editor dialog -- not the Plot Page Viewer dialog. The implementation would require low level mouse processing using legend item geometry determined at the application layer. There would also be a little work to implement context menus on these legend items. Note that legend items have a binary, toggleable state (either as two-state pushbuttons, or checkboxes). We would probably not attempt to disambiguate the initial click as a toggle action.
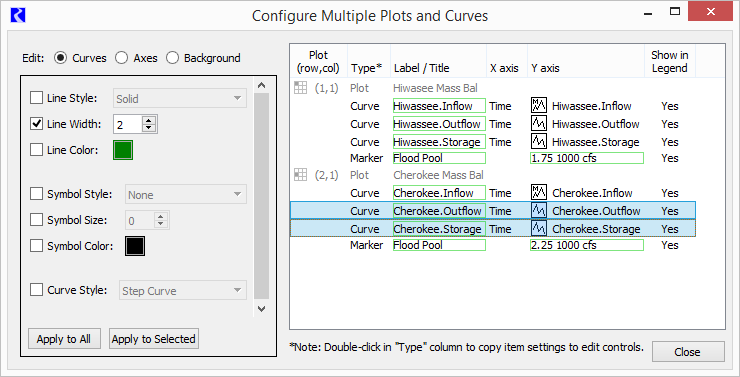
The new Configure Multiple Plot and Curves dialog (to be released in RiverWare 7.1 -- see the document cited above) presents a list with items for all curves and markers in the plots of a single plot page. The initially developed version (completed in March 2017) does not support reordering of curves and markers.
It is important for this dialog to support multiple-item selection, as particular settings can be applied to multiple items in a single operation. Multiple-item selection poses some usability problems with drag-and-drop operation, as an unintended drag operation can be started when the user intends only to define a new multiple-item selection (by dragging the mouse across multiple items). However, we have allowed both mutliple-item selection and drag-and-drop reordering in some item lists in RiverWare. One way to disambiguate these mouse behaviors would be to enable drag-and-drop operation when a "Reorder Items" checkbox is checked.
Alternatively (or additionally), we could provide move-up and move-down arrow icon buttons to operate on the selected items, similar to those implemented in the RiverWare 7.0 Reorder Plot Legend Items popup dialog.
Currently, in RiverWare 7.0, all curves unconditionally show up in the legend, and all of the markers in a plot can be either shown or hidden. (There is one "Display legend items for markers" checkbox for each plot). We would like to support "Show in Legend" checkboxes for each individual curve and marker. An partial provision for this was provided in the initial implementation of the new "Configure Multiple Plots and Curves" dialog -- see the "Show in Legend" column in the screenshot above.
Development tasks include:
Currently, in RiverWare 7.0, curves and markers are "layered" in their legend order. We would like legend order and "layer" to be distinct properties.
We have not yet made use of a "Z"-order property on Qwt curves and markers. Not having done so is what causes the legend order to determine the effective layering (painting) order. (The QwtPlotItem "Z"-order property is a floating point number, but we would expose only integers in the user interface).
Development tasks include:
Development tasks include:
Development tasks include:
Deploying context menus on curves and markers within a plot requires the proximity calculations needed to implement an "Armed" curve/marker state showing a "Hover" ornamentation, and should be provided only, in fact, that Hover ornamentation for armed curves and markers is implemented. See section G.
With Armed ("Hover") curve and marker identification and ornamentation in place, it is a simple matter to deploy a context menu for the armed curve or marker. In the SlotPlot::contextMenuEvent() method, if an armed curve or marker is active, deploy a context menu for that curve or marker in place of the existing plot context menu.
The motivating requirement for this context menu is providing "Move to Top", "Move Up", "Move Down", and "Move to Bottom" actions as right click operations right on curves and markers shown in the plot canvas. Those could either be top-level menu items at (or near) the top of a curve and marker context menu -- OR -- in a "Layer" (or "Layer Order") submenu of that context menu.
Development tasks include the following (after implementing the "Hover" features described in section G).
Markers in RiverWare 7.0 can be either a horizontal line, vertical line, or both ("Cross") -- at constant values on one axis or two perpendicular axes. This is set with the Marker Type radio buttons in the Marker Configuration dialog.
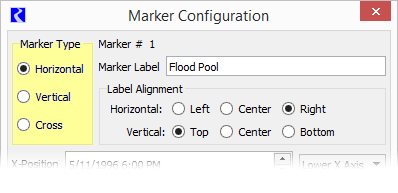
A text label can be specified, shown either along one of the plot edges (for Horizontal and Vertical types) or relative to point identified by two coordinates.
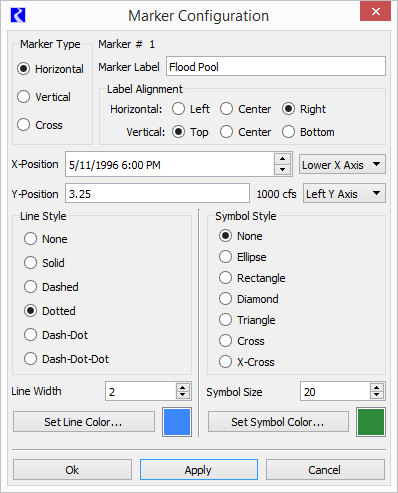
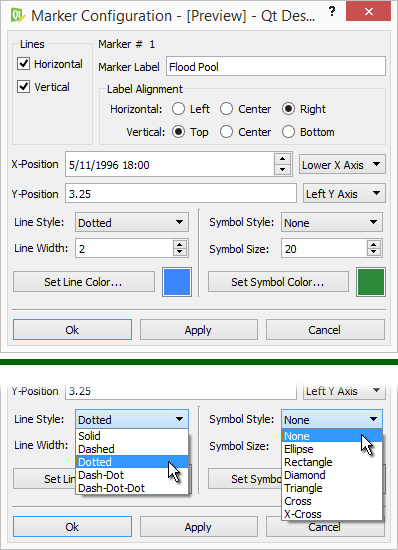
Qwt markers also support a "No Line" mode which results in showing ONLY the text label (plus, optionally, a symbol). We would like to provide that option. The inability for RiverWare to accomplish this use of markers was the subject of Gnats 5901. (The user had hoped that selecting "None" for the marker's Line Style would provide this feature; that was a reasonable expectation, but unfortunately does not work, and was difficult to implement).
Our recommended solution is to:
When a marker has neither a Horizontal or Vertical line, specifications of both the X-Position and a Y-Position are significant. A marker Symbol Style could still be specified; the symbol would be shown at the at the reference point and the label would be shown relative to that point, according to the marker's Label Alignment.
 |
 |
Active "hover" and "selected item" ornamentation requires the following:
We do have working examples of most of these technical requirements, either in RiverWare, or in the example applications provided with Qwt 6.1.3. This includes:
We would have to implement the proximity calculation for Plot Markers, though this is much simpler, being that those are straight lines and/or a single point.
The initial application for the hover state is showing a curve or marker-oriented context menu when the user right-clicks on the plot canvas in proximity to a marker. This would include the "Layer" submenu described in Section E, above.
The selection state isn't initially required for any features being proposed in this document, but would lay the foundation for operations on multiple curves selected graphically, with the mouse. It would also provide a more persistent ornament, e.g. for use in the context of a live presentation. The plot item selection -- of multiple curves and markers -- would function as follows:
Hover state development tasks include:
Selected state development tasks include:
(1) Stockchart: Widget-based Legend
 |
(2) Legend Demonstration: New Qwt 6.1 Legend Classes
  |
(3) Interactive plot: Event Filter
 |
USACE SWD 10: Design Documenting for Improved Plot Legend and Plot Layer Control / Estimates
- Phil Weinstein, CADSWES, 3-26-2017 (a).
| Basic Features Est. Hours |
Features Requiring Custom Legend |
Features Requiring Dynamic Drawing |
Estimate revision: 3-26-2017 (Phil). | |
| A1 | 12.0 | Show Legend Items as Checkboxes | ||
| A2 | 24.0 | Custom Legend Implementation -- needed for: |
||
| B | 6.0 | Alternative Legend Placement: Preliminary task: Selection GUI and persistence. |
||
| B1 | 4.0 |
|
||
| B2 | 16.0 |
|
||
| B3 | 24.0 |
|
||
| C1 | 16.0 | Legend Reordering: Drag and drop within the legend. | ||
| C2 | Legend Reordering: Configure Multiple Plots and Curves dialog. | |||
| 16.0 |
|
|||
| 8.0 |
|
|||
| D | 16.0 | "Show in Legend" -- new curve and marker property, supported in the new Configure Multiple Plots and Curves Dialog. | ||
| E | 8.0 | "Layer" -- new curve and marker property. Preliminary task: "Z value" property to both the GUI and "persistence" data models for curves and markers. |
||
| E1 | 8.0 |
|
||
| E2 | 6.0 |
|
||
| E3 | 10.0 |
|
||
| F | 16.0 | Markers without lines; only a text label and an optional symbol. | ||
| G | Hover highlight and selection of curves and markers, with initial application to layering control (E3). | |||
| G1 | 24.0 |
|
||
| G2 | 10.0 |
|
||
| 116 | 40 | 68 | TOTAL (all specified features: 224 Hours) [Estimate revision: 3-26-2017 (Phil)]. | |
--- (end) ---