USACE SWD 10: Design Document for Improved Plot Legend and Plot Layer Control
Document Home: R:\doc\plotting\2017\CoeSwd10-DesignDocDraft2.docx
Phil Weinstein, David Neumann, Edie Zagona, CADSWES, 4-04-2017 (b). Ready for review.
The USACE SWD task 10 is to develop a design document detailing solutions for improved user control of plot displays. Desired enhancements include but are not limited to:
Related enhancements to the RiverWare plotting system have recently been developed for RiverWare 7.0 and 7.1. Especially relevant to certain features proposed in this document is the new "Configure Multiple Plots and Curves" dialog, described in this document:
This document proposes various additional plotting system features and provides technical development analysis. Only a couple proposed features require the development of a custom legend (also described in this document). Also another couple features require dynamic drawing on the plot canvas -- something we have not yet needed to do.
(1) Feature Overview
Legend Presentation:
(1.1) Legend Location
(1.2) Legend Size
(1.3) Legend Items as Checkboxes
(1.4) Optionally Shown Legend Box
(1.5) Legend Ordering: Drag and Drop of Legend Items
(1.6) Show Curve/Marker in LegendPlot Features:
(1.7) Hover to Highlight Curve
(1.8) Layer Control (Curve and Marker "Z" value).
(1.9) Markers without Lines
(2) Feature Design and Technical Analysis
(2.1) Alternative Legend Placement
(A) Legend on the top, left, right, or not shown
(B) Legend within the plot canvas
(C) Label curves in the plot (instead of a legend)(2.2) Legend Size Features
(A) Configurable Legend Font
(B) Legend Item Spacing
(2.3) Other Legend Appearance Features
(A) Legend Items as Checkboxes
(B) Persistence for Curve/Marker Shown State
(C) Hiding the Legend Border(2.4) Legend Item Ordering Operations
(A) Drag and drop within the legend.
(B) Configure Multiple Plots and Curves dialog:
(1) Drag and drop within the item list
(2) Move up and down widgets, operating on a multiple-item selection.(2.5) "Show in Legend" Curve and Marker Property
Support in the Configure Multiple Plot and Curves dialog.(2.6) "Layer" (Z-Value) Curve and Marker Property
(A) "Layer" column in the Configure Multiple Plot and Curves dialog.
(B) "Layer" context submenu with "Move to Top", "Move Up", "Move Down", and "Move to Bottom" in the Legend Item context menus.
(C) New Curves and Markers context menus (on the plot) with "Layer" action -- See (2.7-A), below.(2.7) Curve and Marker Hover Highlight and Selection of Curves and Markers.
(A) Hover highlight, with initial application to layering (Z-Value) control.
(B) Selection highlight, with selection state available for various configuration operations.(2.8) Markers with lines; only text label and optional point symbol.
(2.9) Software Engineering: Custom Legend Implementation
(3) Technical Notes
(3.1) New Legend Capabilities in Qwt 6.1
(3.2) Dynamically Drawn Plot "Ornaments"
(3.3) Qwt Example: Widget-based custom legend
(3.4) Qwt Example: Legend classes
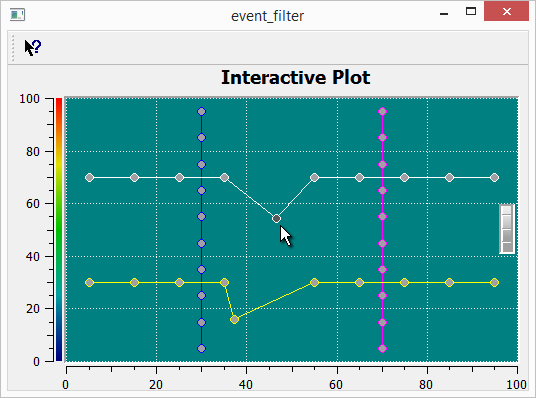
(3.5) Qwt Example: Interactive plot: Event Filter
(4) Development Estimate
Currently in RiverWare, the Legend in shown at the bottom of each plot unconditionally. As requested, we investigated other options for legend location:
Top, Left, Right or None: It is relatively easy to add in any of the three locations outside of the plot area, Top, Left, and Right. It is also relatively easy to not show a legend. [Section 2.1-A].
Within the Plot Area: Within other plotting tools, you can show the legend on the plot area itself. It is possible to enhance the RiverWare plotting package to add this as an option, but would lose some of the interactivity of the legend. Although a simple context menu would be possible, it would not be possible to turn off the curve or drag the legend to re-order. There are also limited locations within the plot area where the legend could exist: the four edges and the four corners, with an adjustable offset. This is still a relatively large task. [Section 2.1-B].
Label Curves instead of a legend: Instead of showing a legend it would be useful to label a curve. This is possible but is technically very challenging due to the zoom and translation that is possible on a plot. There would need to be many configuration options to show it in the correct place. This is a large task. [Section 2.1-C].
Legends take up a relatively large proportion of the plot. We investigated making the legend smaller. First, it would be possible to make fonts on the legend smaller. Technically, they can already be changed, but not on a per-plot basis. This functionality would need to be added. This is a medium task. [Section 2.2-A].
Spacing between legend items could be reduced a bit, either as just a fixed convention, or as a configurable option. This is a small task. [Section 2.2-B].
In Excel, you can resize the legend bounding box or move the legend items closer together. Resizing the legend like this is not possible, as far as we can tell.
Currently, you can click on a legend item and it acts as a push button. When depressed, the curve is hidden and the legend item is grayed out. When not depressed (i.e. happy), the curve is shown and the legend item appears enabled. Many tools use checkboxes as a similar feature. Checkboxes require less vertical space, but more horizontal space, than the current legend buttons. Presenting legend items as checkboxes would the implementation of a custom legend, which is a large task. But with that in place, providing an option to present legend items as checkboxes would be relatively straightforward. [Section 2.3-A].
The persistence of either push-button or checkbox settings can be enhanced to be saved from the edit dialog. [Section 2.3-B].
The rectangular border around a plot's legend is not necessarily desirable. We could provide a configuration option to optionally show or hide that border. [Section 2.3-C].
Adding Drag and Drop of legend items to reorder is possible only if a custom legend is implemented. [Section 2.4-A].
It is also possible to add drag and drop within the legend configuration and multiple plot curve configuration, but doing so would interfere with multiple selections that is currently standard. We could add modes or some other way to add this functionality if necessary. [Section 2.4-B].
Currently Curves are unconditionally shown in the legend. Markers can either be shown or not, but the setting applies to all markers on a plot. It is desirable to create a setting to allow the user to say that they don't want to show a particular curve in the legend. This is a relatively straightforward task. [Section 2.5].
Many plotting utilities allow the user to hover or click on a particular curve and then get options associated with just that curve. In addition, ornamentation like a halo or highlight could be added. This is a large task but is possible. Once implemented, it would be relatively easy to add many options like Open Slot or Move to Top Layer. [Sections 2.7].
Currently, the drawing layer, i.e. which curve is drawn on top, is tied to the legend order. We propose to break this out and allow user configuration. This would be presented and configured in the same location as the legend order. Additional options would be added to right click on a legend and tell a curve to "Move Up", "Move to Top", "Move Down", "Move to Bottom." This is relatively small task. [Section 2.6].
Markers must currently show a line along with a label. It may be useful to show the marker label (at the specified X and Y value) without showing a line. This is a small task. [Section 2.8].
Plots in RiverWare 7.0 and prior versions unconditionally show the legend below the plot. Four distinct alternatives are considered in subsequent sections:
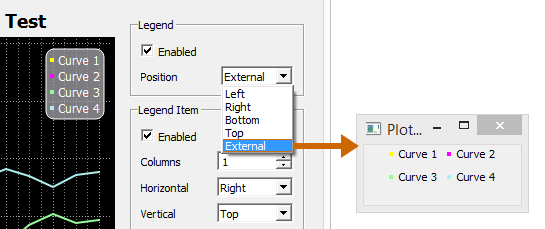
Although the implementations of the first three alternatives are quite different -- and technically could be simultaneously shown -- we prefer to show the legend in only one way for a particular plot at any given time. A Plot Legend selector (ComboBox) will be added to the plot configuration with the following items -- depending on what options are actually implemented:
This choice needs to be represented within both the Plot GUI and "PlotInfo" data model (with serialization).
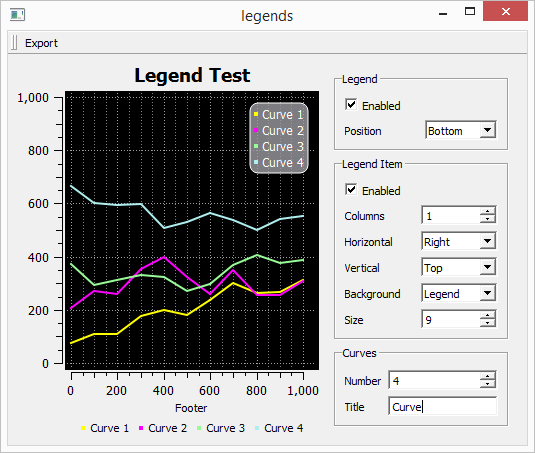
The Qwt plot legend doesn't have to be below the plot. It can instead be placed on the top or right or left sides -- or not shown at all. These options can readily be applied to either the current legend implementation or a new custom legend implementation (see section 2.9).
Implementation note: The current legend implementation is based on the QwtLegend class, a subclass of QwtAbstractLegend. A custom legend implementation (section 2.9) would also be derived from QwtAbstractLegend. Legend placement on any of the four sides of a plot is done with the QwtPlot::insertLegend (QwtAbstractLegend*, QwtPlot::LegendPosition, double ratio) method. See the current use of QwtPlot::insertLegend() in SlotPlot::configurePlot().
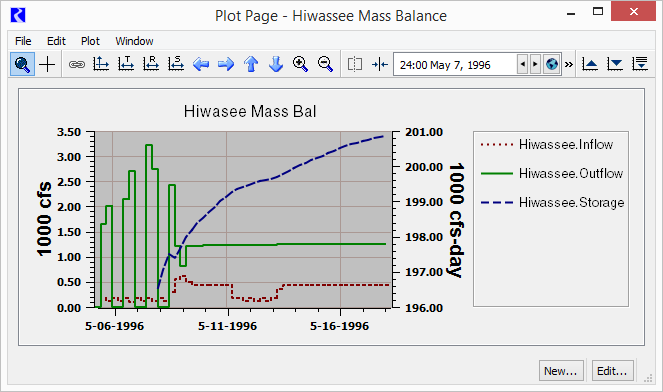
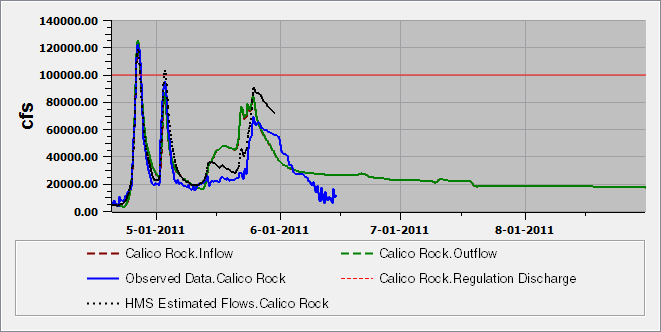
The image below demonstrates placing the legend to the right of the plot, instead of below. This is using Qwt's default legend implementation (class QwtLegend). [Note that this screenshot is showing the current default legend item spacing of 6 pixels. Other screenshots in this document illustrate a tighter spacing -- using a 2 pixel spacing. Also it is possible to hide the frame around the legend items].
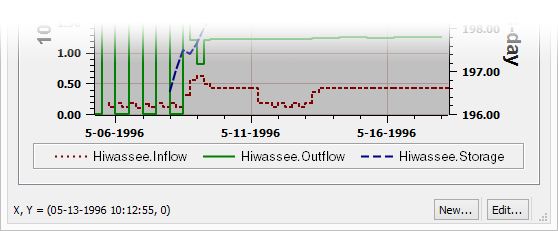
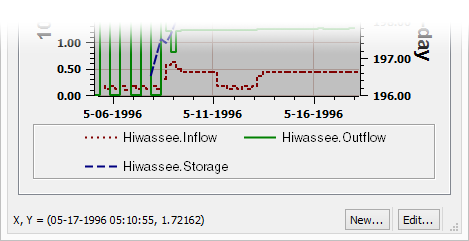
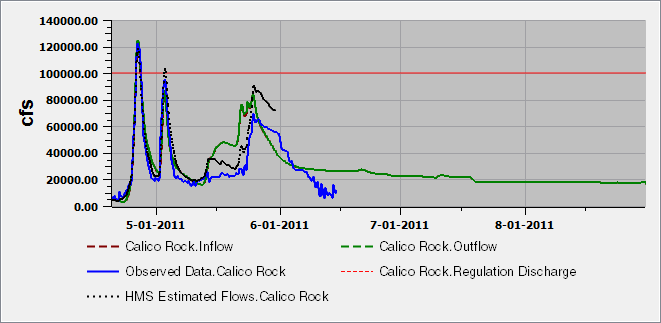
... compare this to the current RiverWare 7.0 support of the legend being shown along the bottom of the plot:
Notes:
Limitation: Display Only; no interaction, with the exception of a context menu.
We can support an option to show the legend within the plot, position in any of the four corners, or centered on any of the four sides. The distance from the sides (in pixels) can also be set.
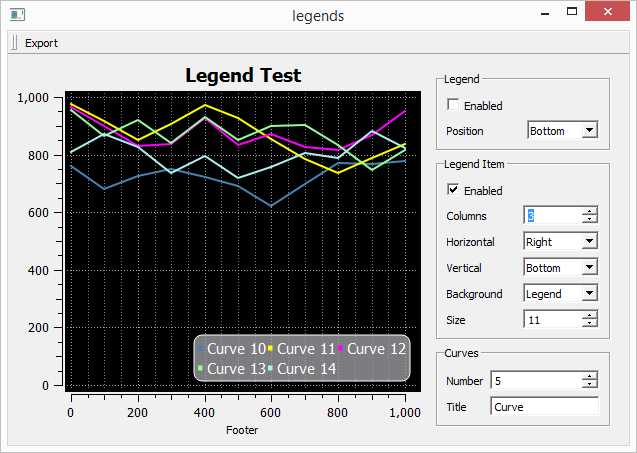
Legends shown this way will lack these features:
Implementation of the legend context menu on this legend will require some custom coding using an event filter.
Technical Analysis:
As mentioned in section (3.1) "New Legend Capabilities in Qwt 6.1", it is possible to show a static legend within the plot. See also section (3.4) "Qwt Example: Legend classes". Unfortunately, the C++ class which implements the legend within the plot doesn't make available to the application any mouse event notifications. The individual items within the legend do not support a toggle state. The following is from the description of the QwtPlotLegendItem class:
In opposite to QwtLegend, the legend item is not interactive. To identify mouse clicks on a legend item an event filter needs to be installed catching mouse events on the plot canvas. The geometries of the legend items are available using
legendGeometries(). [http://qwt.sourceforge.net/class_qwt_plot_legend_item.html].
So, it would be technically possible to support some interactivity within this in-plot legend, but it would require low-level coding which we are not recommending we pursue, other than possibly for a context menu.
Note that the relevant Qwt terminology is confusing. QwtPlotLegendItem is an "item" in that it is a QwtPlotItem (a thing that can be displayed on the plot canvas, like a curve or marker). It represents the entire legend. But it, itself, has child "item" components -- for the QwtPlotItems (curves and markers) represented within the legend.
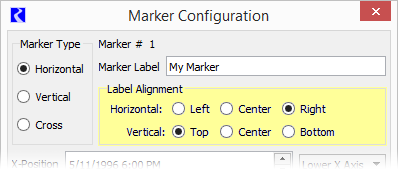
Qwt plot markers (but not slot curves) natively support text labels which can be "aligned" (positioned) in the standard nine positions relative to its reference coordinates. (The interpretation of this alignment depends on the marker type: Horizontal, Vertical, or Cross).
 |
It would be difficult, though possible, to show text labels in the plot for slot curves. This would require an unusual provision in Qwt to perform some "extra" painting at the tail end of a paint event, making use of an event filter and the QwtPlotDirectPainter class. The Interactive plot: Event Filter example cited in section 3.5 shows a simple example of such a mechanism.
We would also need to define and implement a text placement algorithm for the curve text label. This needs to appear on the plot at any zoom level when the curve is visible within the plot. This could have the following provisions for each curve:
Development tasks include:
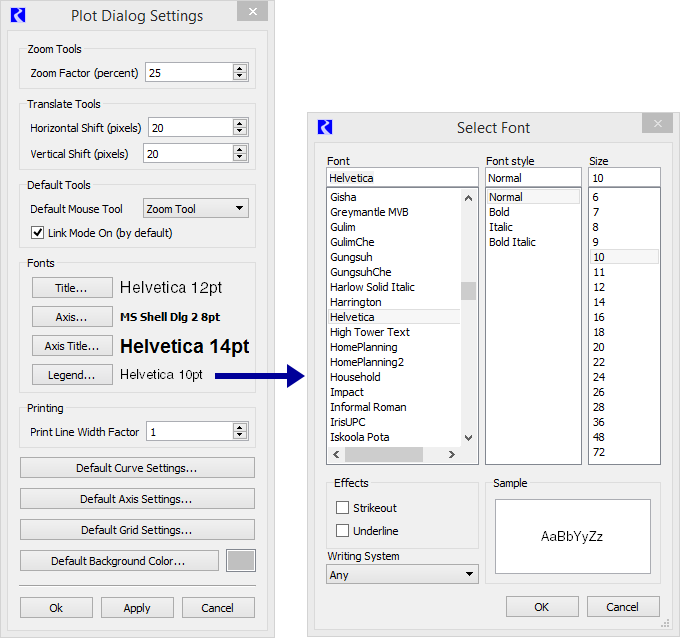
The current plot font support (e.g. in RiverWare 7.0) is limited to four font specifications stored in user-login based settings. These are configured in from the Plot Dialog Settings dialog shown here:
 |
|
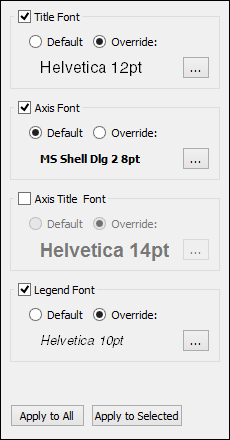
We could implement font overrides for individual plots. We would probably want to support this for all four configurable font uses:
Technically, this could be implemented at the "plot page" level, but that is not something we have generally done. Instead, we would prefer to implement such plots at the single-plot level, and provide tools for replicating those settings to the other plots within the plot page.
One way to do this would be to add provisions in the new "Configure Multiple Plots and Curves" dialog for setting fonts on selected plot items within a plot page. (Perhaps a new "Fonts" mode, or a reformulation of existing plot setting modes). The four different font uses would be individually enableable for application to the selected plots. If "Default" is selected for a particular plot feature, the global plot font setting (configured in the Plot Dialog Settings dialog shown above) would be used.
Development would require adding four persistent font specifications to the PlotInfo record, including serialization for the new fields.
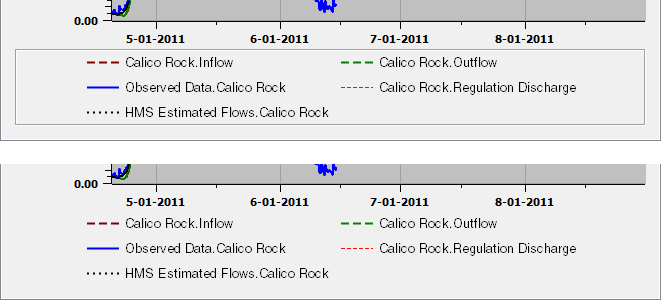
We would be able to tighten up the spacing between legend items, even with the current legend implementation. (The development of a custom legend would not be necessary).
However, the limited amount that we can reasonably reduce this spacing may not warrant a configurable option. We may want to just make this change -- apply tighter spacing -- without user configurability. Note that hiding the legend border -- see Section (2.3-C) -- also reduces the amount of space taken up by the legend.
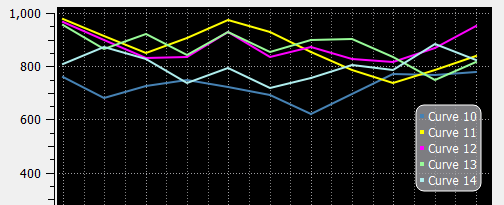
The screenshots below illustrate the current default spacing (6 pixels) and reduced spacing (of 2 pixels). Note that, when clicked "off", they are presented as depressed buttons, with a sunken frame. So, this could be made a bit tighter when these legend items are instead presented as checkboxes (which is another optional enhancement being considered in this document).
![]()
Just making this as a non-optional change would not require any additional development. But if we make this change optional, we need to add this as a setting -- either the number of pixels -- or just a checkbox for "tighter" legend spacing -- in the configuration GUI and the PlotInfo record, with data model persistence.
Technical: with the current QwtLegend-implemented legend, to adjust this spacing, we need to "reach into" the QwtLegend's "contents widget". The effect above (tighter spacing) was achieved with this additional code:
|
The Qwt legend mechanism provides three options for the appearance of legend items:
The QwtLegend class, and QwtLegendLabel, present the "Clickable" choice as a typical pushbutton, and "Checkable" as a two-state pushbutton, where the "2nd state" has a depressed appearance with grayed out text. RiverWare's current legend items are of the latter type, with the depressed state causing the curve or marker to not appear in the plot.
An option to present legend items as checkboxes would require a custom legend implementation. (See section 2.9). The presentation of legend items as checkboxes works particularly well with the legend on the left or right side of the plot (see section 2.1-A), where the items would be presented in a single column.
Beyond the development of a custom legend, providing an option to present legend items as checkboxes would require the following development tasks:
Independent of providing an option to show legend items as checkboxes (see the prior item), legend items have an on-or-off state to indicate whether the corresponding curve or marker appears within the plot canvas. Currently (as with RiverWare 7.0), hiding a curve or marker in this way is a strictly temporary state; the next time the plot page is shown, all curves are markers are again shown.
Note that this is not about whether or not a curve or marker is represented within the legend (see section 2.5). Rather, it is about the "on or off" state of that legend item.
The current behavior, as described above may actually be desirable. (So, this needs to be carefully considered). But we could choose to make this state persistent, saved with the plot page configuration in the model file.
Legends are currently (e.g. in RiverWare 7.0) presented within a box. The current legend implementation does readily support the hiding of this box. Here is a comparison of a legend with and without this border, and full screenshots of plots with these variations.
The visibility and display attributes of this box are controlled in a base class (QFrame) which is common to both the default legend implementation and any custom legend we would provide. That is we would not have to implement a custom legend to hide or modify the appearance of this box border, but if we did so after implementing a "show legend border" option (which could be turned off), no additional changes would be required.
This code snipped demonstrates code for legend box visibility (commented out), and no legend box.
|
Development would require adding a checkbox to the Plot configuration GUI, and adding a flag field to the "PlotInfo" data model (with serialization).
In RiverWare 7.0, legend reordering is done in a separate popup dialog:
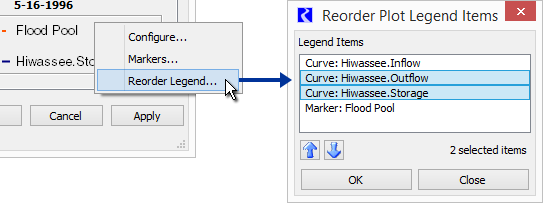 |
Two alternative approaches to reordering legend items are described in subsequent sections:
It doesn't seem to be possible to implement drag-and-drop operations within the current legend implementation (using the default QwtLegend class). We would first need to reimplement the legend by subclassing QwtAbstractLegend. See the following two sections, above:
A drag and drop behavior on legend items would be active only within the Plot Page Editor dialog -- not the Plot Page Viewer dialog. The implementation would require low level mouse processing using legend item geometry determined at the application layer. There would also be a little work to implement context menus on these legend items. Note that legend items have a binary, toggleable state (either as two-state pushbuttons, or checkboxes). We would probably not attempt to disambiguate the initial click as a toggle action.
The new Configure Multiple Plot and Curves dialog (to be released in RiverWare 7.1 -- see the document cited above) presents a list with items for all curves and markers in the plots of a single plot page. The initially developed version (completed in March 2017) does not support reordering of curves and markers.
It is important for this dialog to support multiple-item selection, as particular settings can be applied to multiple items in a single operation. Multiple-item selection poses some usability problems with drag-and-drop operation, as an unintended drag operation can be started when the user intends only to define a new multiple-item selection (by dragging the mouse across multiple items). However, we have allowed both multiple-item selection and drag-and-drop reordering in some item lists in RiverWare. One way to disambiguate these mouse behaviors would be to enable drag-and-drop operation when a "Reorder Items" checkbox is checked.
Alternatively (or additionally), we could provide move-up and move-down arrow icon buttons to operate on the selected items, similar to those implemented in the RiverWare 7.0 Reorder Plot Legend Items popup dialog (illustrated at the beginning of section 2.4).
Support in the Configure Multiple Plot and Curves dialog
Currently, in RiverWare 7.0, all curves unconditionally show up in the legend, and all of the markers in a plot can be either shown or hidden. (There is one "Display legend items for markers" flag for each plot). We would like to support "Show in Legend" checkboxes for each individual curve and marker.
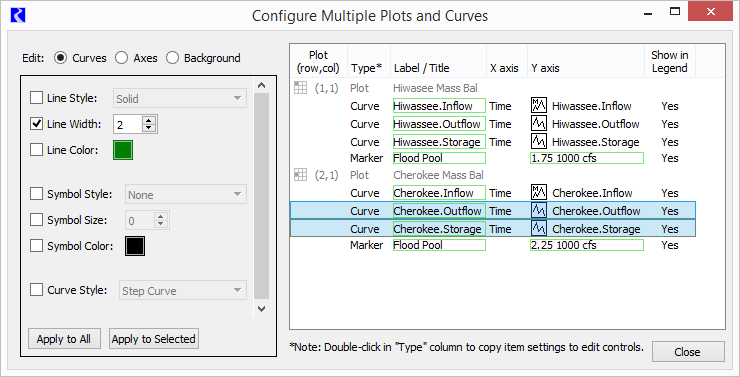
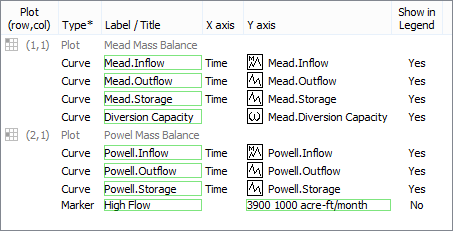
A partial provision for this was provided in the initial implementation (for RiverWare 7.1) of the new "Configure Multiple Plots and Curves" dialog. See the rightmost column, "Show in Legend," in the item list panel in that dialog:
Development tasks include:
Currently, in RiverWare 7.0, curves and markers are "layered" in their legend order. We would like legend order and "layer" to be distinct properties.
We have not yet made use of a "Z"-order property on Qwt curves and markers. Not having done so is what causes the legend order to determine the effective layering (painting) order. (The QwtPlotItem "Z"-order property is a floating point number, but we would use, and expose only integers in the user interface).
Development tasks include:
Development tasks include:
Development tasks include:
Deploying context menus on curves and markers within a plot requires the proximity calculations needed to implement an "Armed" curve/marker state showing a "Hover" ornamentation, and should be provided only if that Hover ornamentation for armed curves and markers is implemented. See section (2.7-A).
With Armed ("Hover") curve and marker identification and ornamentation in place, it is a simple matter to deploy a context menu for the armed curve or marker. In the SlotPlot::contextMenuEvent() method, if an armed curve or marker is active, deploy a context menu for that curve or marker instead of the existing plot context menu.
The motivating requirement for this context menu is providing "Move to Top", "Move Up", "Move Down", and "Move to Bottom" actions as right click operations right on curves and markers shown in the plot canvas. Those could either be top-level menu items at (or near) the top of a curve and marker context menu -- OR -- in a "Layer" (or "Layer Order") submenu of that context menu.
Development tasks include the following (after implementing the "Hover" features described in section 2.7).
Active "hover" and "selected item" ornamentation requires the following:
We do have working examples of most of these technical requirements, either in RiverWare, or in the example applications provided with Qwt 6.1.3. This includes:
We would need to implement the proximity calculation for Plot Markers, though this is much simpler, being that those are straight lines and/or a single point.
The initial application for the hover state is showing a curve or marker-oriented context menu when the user right-clicks on the plot canvas in proximity to a curve or marker. This would include the "Layer" submenu described in section (2.6-C).
Development tasks:
The selection state isn't initially required for any features being proposed in this document, but would lay the foundation for operations on multiple curves selected graphically, with the mouse. It would also provide a more persistent ornament, e.g. for use in the context of a live presentation. The plot item selection -- of multiple curves and markers -- would function as follows:
Development tasks:
Markers in RiverWare 7.0 can be either a horizontal line, vertical line, or both ("Cross") -- at constant values on one axis or two perpendicular axes. This is set with the Marker Type radio buttons in the Marker Configuration dialog:
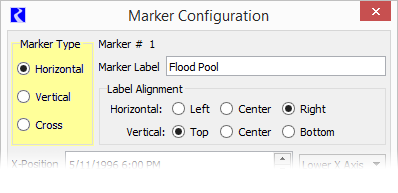
A text label can be specified, shown either along one of the plot edges (for Horizontal and Vertical types) or relative to point identified by two coordinates.
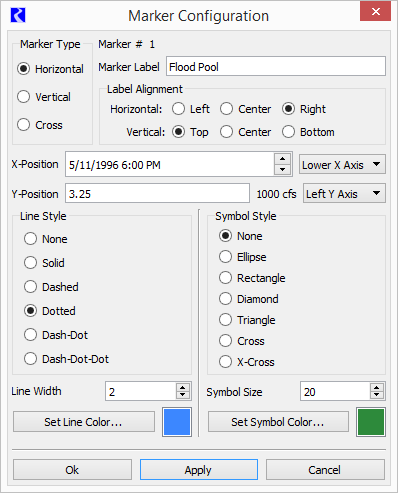
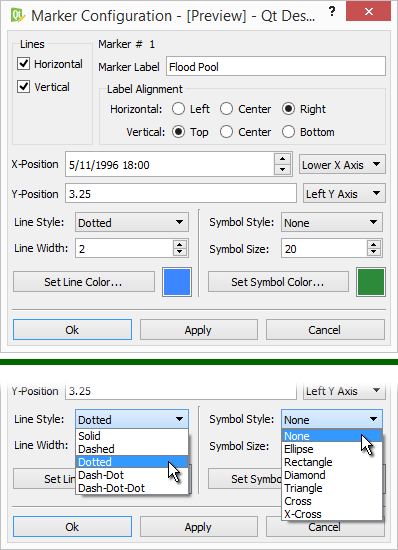
Qwt markers also support a "No Line" mode which results in showing ONLY the text label (plus, optionally, a point symbol). We would like to provide that option. The inability for RiverWare to accomplish this use of markers was the subject of Gnats 5901. (The user had hoped that selecting "None" for the marker's Line Style would provide this feature; that was a reasonable expectation, but unfortunately does not work, and was difficult to implement).
Our recommended solution is to:
When a marker has neither a Horizontal or Vertical line, specifications of both the X-Position and a Y-Position are significant. A marker Symbol Style could still be specified; the symbol would be shown at the at the reference point and the label would be shown relative to that point, according to the marker's Label Alignment.
 |
 |
Plots in RiverWare 7.0 and prior versions use Qwt's default legend class, QwtLegend with items for individual curves and markers implemented by QwtLegendLabel. Use of this legend class provides less control over the legend than would a custom implementation made possible by new provisions in Qwt -- See section (3.1) "New Legend Capabilities in Qwt 6.1".
The following two enhancements proposed in this document require the implementation of a custom legend, as a subclass of QwtAbstractLegend.
A substantial amount of development will be required to implement a custom legend. We'll want to make sure that its functionality is complete and correct with respect to that of the default QwtLegend class. For one thing, the behavior of "wrapping" legend items (e.g. when they appear below the plot) according to the available width of the plot dialog is implemented with a special Qt layout manager provided by Qwt (class QwtDynGridLayout, a direct Qt5 QLayout subclass) -- we may need to "take over" that code -- or other similar supporting classes -- if they don't support behaviors we may want. During implementation, it will be useful to examine the source code for the QwtLegend class, which is, itself, a QwtAbstractLegend subclass.
Note: Qwt source code and built Qwt demonstration/example programs, are available under our local development machine "RiverWare/Tools" directory, at these locations:
- C:\Riverware\tools\Qwt-613_Qt-551\src
- C:\Riverware\tools\Qwt-613_Qt-551\examples\bin
General notes:
Qwt 6.1 (we're using Qwt 6.1.3, the latest available version, with Qt 5.5.1) provides two new unrelated legend capabilities. A plot can actually have one of each, but these capabilities do not otherwise complement each other.
 |
This class directly supports the following settable properties, which could be presented as persistent settings, or just hard-coded values:
- Alignment (corner or side) and "borderDistance" (as mentioned above).
- Number of columns (in an automatic-flow layout). A value of one (1) is demonstrated above. If "unlimited" is specified, the items would be arranged horizontally, in a single row.
- Legend margin, item margin and item spacing.
- Text color ("pen"), border color ("pen"), and background color and pattern ("brush"). Qt colors can have partial transparency (an alpha channel), as demonstrated in the background color illustrated above.
- Alternative option to show each item in its own frame, instead of an overall frame for the legend.
- Border radius (rounded corners).
Use of QwtPlotLegendItem is discussed in section:
As demonstrated in one of the examples provided with Qwt, some graphical features can be drawn on the plot canvas at the tail end of "paint event" processing. The "Interactive Plot" example (cited in the appendix) does this for one simple ornamentation: the "currently selected" curve point (in that little demonstration program). Such drawn ornaments do not exist as objects; we wouldn't be able to directly implement any mouse interaction with those features.
Implementation of this sort of drawing mechanism would be required for the following features.
 |
  |
 |
USACE SWD 10: Design Document for Improved Plot Legend and Plot Layer Control / Estimates
- Phil Weinstein, CADSWES, 4-04-2017 (a).
| Basic Features Est. Hours |
Features Requiring Custom Legend |
Features Requiring Dynamic Drawing |
Estimate revision: 4-04-2017 (Phil). | |
| 2.1 | 6.0 | Alternative Legend Placement: Preliminary task: Selection GUI and persistence. |
||
| 2.1 A | 8.0 |
|
||
| 2.1 B | 20.0 |
|
||
| 2.1 C | 32.0 |
|
||
| 2.2 | Legend Size Features | |||
| 2.2 A | 16.0 | Configurable Fonts for each Plot (Legend Font and other fonts). | ||
| 2.2 B | 0.0* | Legend Item Spacing. *Recommendation: Just tighten up spacing, not as a configurable setting. Otherwise, 6.0 hours for setting widget and SlotPlot field with persistence. | ||
| 2.3 | Other Legend Appearance Features | |||
| 2.3 A | 20.0 | Legend Items as Checkboxes | ||
| 2.3 B | 6.0 | Persistence for Curve/Marker Shown State | ||
| 2.3 C | 6.0 | Hiding the Legend Border | ||
| 2.4 A | 16.0 | Legend Reordering: Drag and drop within the legend. | ||
| 2.4 B | Legend Reordering: Configure Multiple Plots and Curves dialog. | |||
| ... 1 | 16.0 |
|
||
| ... 2 | 8.0 |
|
||
| 2.5 | 16.0 | "Show in Legend" -- new curve and marker property, supported in the new Configure Multiple Plots and Curves Dialog. | ||
| 2.6 | 8.0 | "Layer" (Z-Value) Curve and Marker Property Preliminary task: "Z value" property to both the GUI and "persistence" data models for curves and markers. |
||
| 2.6 A | 8.0 |
|
||
| 2.6 B | 6.0 |
|
||
| 2.6 C | 10.0 |
|
||
| 2.7 | Hover highlight and selection of curves and markers, with initial application to layering control (2.6-C). | |||
| 2.7 A | 24.0 |
|
||
| 2.7 B | 10.0 |
|
||
| 2.8 | 16.0 | Markers without lines; only a text label and an optional symbol. | ||
| 2.9 | 32.0 | Custom Legend Implementation -- needed for: (2.3 A) Showing legend items as checkboxes. (2.4 A) Drag and drop reordering within the legend. |
||
| 140.0 | 68.0 | 76.0 | TOTAL (all specified features: 284 Hours) [Estimate revision: 4-04-2017 (Phil)]. |
|
--- (end) ---