TVA / RTI Estimates / Plotting -- October 2015
Phil Weinstein, David Neumann, Edie Zagona, CADSWES, 10-2-2015
| Task | Est. (hours) |
Description |
| 1.1 | 24 | Plotting Scalar Slots |
| 1.2 | 24 | Dynamic Markers |
| 1.3 | 32 | Secondary Vertical Axis |
| 1.4 | 20 | Text Annotations on Plots |
| 2 | 48 | Symbolic Date Control of Plot Ranges, including 24 hours to finalize analysis and design. |
| 3 | 34 | Plot Triggering: SCT to Plotting linkage |
| 4 | 4 | Add Script menu to SCT |
| 186 | Total Hours (estimate, Phil, 10-2-2015) |
All of these tasks, with the exception of the last minor one, involve RiverWare's Plotting system, implemented with the Qwt open source C++/Qt library. The following general issues apply to most of these tasks.
Currently all "Slot Curves" represented within the plot configuration user interface correspond to exactly one Qwt Plot Item object. (Our SlotCurve class derives from QwtPlotCurve, so this one-to-one association is fundamental). It is not natural to implement what the user sees as a single plot "item" with multiple low-level Qwt Plot Item objects, as may be necessary or desirable when addressing some of the new plotting requirements.
In some cases, however, a desirable alternative to deploying multiple Qwt Plot Item objects is making use of the ability for a plot curve to have multiple discontinuous pieces, i.e. by inserting "NaN" numeric values into the series data. A minor source code change was necessary to make this work in Qwt 5.2.3 -- but that looked to be a fix to a bug in that code, and that using "NaN" values in this way was actually an intended feature. We will need to ensure that the newer version of Qwt (6.1.2 or later) correctly supports this use of "NaNs" in series data.
For what it's worth, one place where the necessary one-to-one association between SlotCurves and QwtPlotCurves shows up is our implementation of Table Slot Contour Curves, where the plot features coming from a single Table Slot necessarily result in creating a SlotCurve instance for each contour. In this case, this is actually appropriate, so that a different color can be associated with each contour.
In some instances, the plot configuration user interface applies changes directly to Qwt objects, and that information is subsequently read from those objects into our own plot configuration data structures. That has the effect of "marrying" our plot feature configuration information to exactly what is supported in Qwt objects, and may also create difficulty in breaking away from the one-to-one correspondence between application-level plot objects and Qwt plot object instances.
Markers and Curves are two different native Qwt plot items which are directly reflected in the plot user interface. Markers can have text labels, curves cannot. All curves have an associated item in the plot legend. A recent enhancement to RiverWare allows markers to also be represented in the plot legend -- this is a single option that applies to all markers in a plot.
With this development, we would like to address the lack of direct support for plotting Scalar Slots. This should be analogous to plotting a Series Slot, but as a straight line (and with a special provision that Date/Time-unit Scalar Slots should plot as vertical lines at the slot's value on the horizontal time axis). Scalar Slots plotted as slots should show up as slots (not markers) in the plot page configuration user interface.
But also, there is a requirement to show a text label for dynamic markers tied to the value of a Scalar Slot. This will also be implemented, but, of course, as a Marker, not a Curve. This is discussed further below.
We've decided that it would be desirable, and very reasonable, to upgrade RiverWare's Qwt library from Qwt 5.2.3 to the latest available Qwt 6.1 version. This is a prerequisite for our port from Qt 4.8 to Qt 5 (currently at Qt 5.5). Also, the newer Qwt library provides additional features which we would like to have available for this implementation. One example is the QwtPlotShapeItem class, which allows the plotting of an arbitrary custom defined geometric feature. We don't have a precise estimate for this port, but it would probably take about 4 full days.
In the current version of RiverWare (6.7), the following are not supported:
As mentioned above, we would like to support Scalar Slots, independently, directly, in both of these ways.
Slots are added to Plots in various ways. Ideally, in each of these ways, allowing the selection of Scalar Slots (or otherwise, accommodating the support for Scalar Slots) would need to be provided.
Of course, Scalar Slot values would be plotted as straight lines, with special handling for those having DateTime units. In a time plot (where the bottom horizontal axis represents time), DateTime Scalar Slots would be plotted as vertical lines. Otherwise, they would be plotted as horizontal lines, at a position within a vertical axis (left or right) which matches the Scalar Slot's units.
For DateTime Scalar Slots specifying a "partial" (periodic) Date/Time Value (e.g. "October 1"), a vertical line would appear for that slot in each visible "October 1" (of each year) being displayed on the plot. This will be done in a single series plot, with NaNs to delimit the top/bottom coordinate pairs associated with each vertical line. This would need to be recomputed dynamically each time the size of the visible area of the plot changes.
| Estimate (Hours) |
||
| (1) | 6.0 | Slot Plot Client Adjustments (see the 7 enumerated items above). |
| (2) | 18.0 | Creation of a ScalarSlotCurve subclass of possibly SeriesSlotCurve (as is the case for PeriodicSlotCurve), with dynamic adjustment of the endpoints as the window is resized. Special handling may be required for DateTime values (plotted vertically). |
| TOTAL | 24.0 | (estimate: Phil, 10-2-2015). |
|
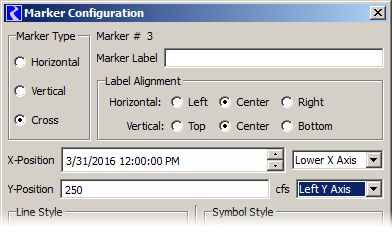
A marker can have independent associated values in both the X and Y dimensions. Many markers have only a single dimension -- i.e. for a vertical or horizontal line. Currently (in RiverWare 6.7), only constant values can be used -- defined right within the Marker Configuration Dialog, see the image to the right.
This needs to be redesigned to accommodate values from other sources. Value sources should include:
For Date/Times, only fully specified date/time values will be supported in markers. (Partial Date/Times will be supported only for Scalar Slots plotted as slots, see the prior section).
| Estimate (Hours) |
||
| (1) | 8.0 | User Interface Design |
| (2) | 16.0 | Implementation |
| TOTAL | 24.0 |
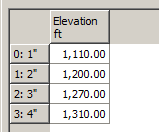 |
It is desirable to be able to show a "secondary" axis associated with the left and right vertical axes. This will be displayed with arbitrary textual labels (not necessarily numeric) and tick marks on the inside of the vertical axis (actually within the plot). The data for this feature, for either the left or right axis, is defined with a custom Table Slot on a Data Object. See the example to the right.
This will be implemented with Qwt Plot Items, but will show up in the user interface as just one or two references to table slots associated with a plot (perhaps within the Axis configuration of the left and right axis). The tick marks will be implemented probably as a single QwtPlotCurve (with NaNs between each tick mark). The axis tick labels will be implemented as QwtPlotItems with text, but no vertical or horizontal line. The geometry of these features will need to be recomputed dynamically each time the size of the visible area of the plot changes. Secondary vertical axis text will be shown with the Axis font configured for the plot page.
| Estimate (Hours) |
||
| (1) | 8.0 | User Interface Design |
| (2) | 24.0 | Implementation |
| TOTAL | 32.0 |
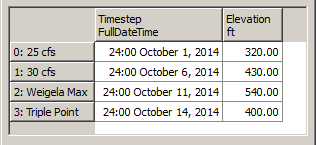 |
It is desirable to place textual annotations on plots at actual data coordinates. For any particular plot, this will be accomplished with a reference to a custom Table Slot on a Data Object. See the example to the right.
This will be implemented with QwtPlotMarkers having only text, but no associated vertical or horizontal line. This will show up in the user interface as just a reference to a table slot associated with a plot. Text will be shown with the Axis font configured for the plot page. No dynamic recomputation (e.g. when the size of the visible area of the plot changes) will be necessary.
| Estimate (Hours) |
||
| (1) | 8.0 | User Interface Design |
| (2) | 12.0 | Implementation |
| TOTAL | 20.0 |
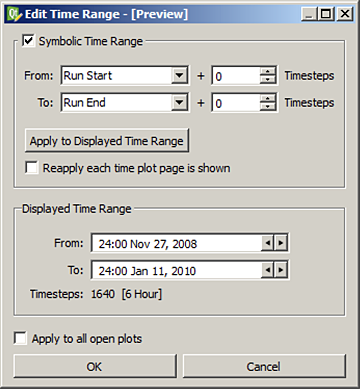 |
A draft proposal for this feature was devised a year ago, in late September 2014. That called for an enhancement of the existing "Edit Time Range" dialog to support optionally "sticky" symbolic date/times. See the September 28, 2014 document entitled, "RiverWare Potting Enhancements for TVA FEWS - DRAFT" and the mockup to the right.
Given the persistent nature of the new feature being fundamentally a "configuration" setting, it was felt that this should instead be explicitly provided as an enhancement to a plot's configuration. This led to a more complicated design which also attempted to address the unrelated issue of the need for the user to explicitly re-save the plot page in order for any changes made to the plot page configuration to persist.
This design also did not make use of RPL Symbolic Date/Times for the symbolic dates (e.g. a specified number of timesteps before "beginning of run") -- something we may want to consider.
See this document and collection of review notes:
We will need a few days to reassess the approach we want to take. We could consider just going back to the original idea enhancing the existing "Edit Time Range" dialog to support optionally "stick" symbolic date/times.
| Estimate (Hours) |
||
| (1) | 24.0 | Analysis and User Interface Design |
| (2) | 24.0 | Implementation |
| TOTAL | 48.0 |
The following analysis and estimates were completed a year ago, on 9-19-2014 as part of a larger analysis of SCT enhancements for TVA. See this document:
This included also the following features which have already been implemented:
- Custom Time-Aggregation Summary Rows (only in the aggregated vertical timestep view) [RW 6.6 and 6.7]
- Support for multiple Series Slots tabs ("Sheets") [RW 6.6]
- Automatic re-evaluations of RPL Expression series slots shown in the SCT at single timesteps.[RW 6.7]
| Hours (est) |
Task | |
| 5.1 | 4.0 | Enhancement of the Plot Page data model to indicate that this feature is active for a Plot Page, and which curves within the various (up to 9) plots contained in that Plot Page. |
| 5.2 | 6.0 | Enhancement of Plot Page (Output Device) configuration dialog with the new checkbox and conditionally shown checkbox on the individual slot items (QTreeWidgetItems). Note that this configuration dialog is an application of the SlotSetOutputConfigDlg class. |
| 5.3 | 4.0 | Generation of object context notifications from the SCT to Plot Pages via Sim/cwOutputDeviceMgr. We'll define a public method on that manager class which will be called from the SCT. That method will create and issue a callback which will be processed by Q3GUI/PlotDialog instances. |
| 5.4 | 16.0 | Make substitutions in the live curves, including the algorithm outlined above for slots on data objects; and force a redraw. |
| 4.0 | Post-development Review Changes | |
| 34.0 | Total hours, (estimate, Phil, 9-14-2014). |
Adding the Scripts menu -- which now appears in the RiverWare Workspace -- to the SCT can be done quite easily. The implementation of that menu in our Q3GUI/Workspace class doesn't depend on anything within that class, so can readily be replicated within the SctDialog class.
| Estimate (Hours) |
||
| (1) | 4.0 | Implementation |
--- (end) ---