Plotting Scalar Slots in RiverWare -- Analysis
Phil Weinstein, David Neumann, CADSWES, 9-16-2015
As of RiverWare 6.7, RiverWare Plots -- Plot Page Output Devices implemented with the Qwt plotting package -- do not support the plotting of Scalar Slots.
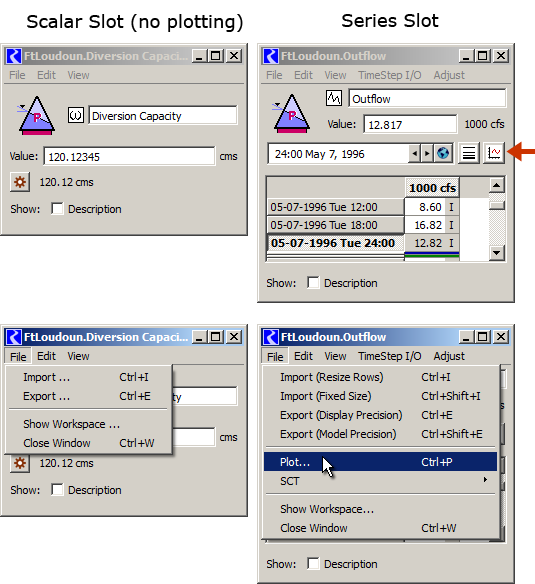
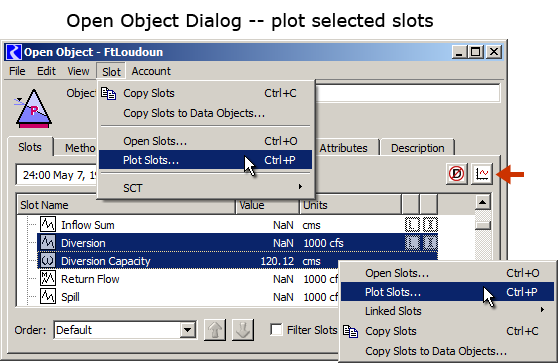
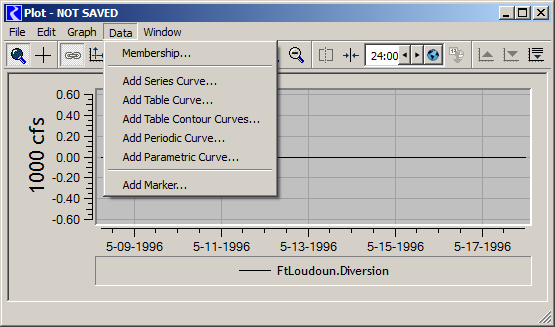
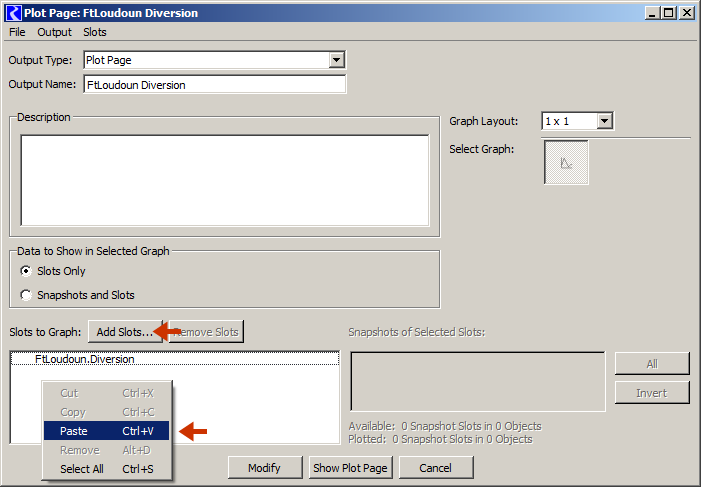
Slots are added to Plots in various ways. Ideally, in each of these ways, allowing the selection of Scalar Slots (or otherwise, accomodating the support for Scalar Slots) would need to be provided. (See images in the APPENDIX).
Of course, Scalar Slot values would be plotted as straight lines, with special handling for those having DateTime units. In a time plot (where the bottom horizontal axis represents time), DateTime Scalar Slots would be plotted a vertical lines. Otherwise, they would be plotted as horizontal lines, at a position within a vertcial axis (left or right) which matches the Scalar Slot's units.
Internally, using Qwt 5.2.3, the idea of using a "marker" (QwtPlotMarker) instead of a "curve" (QwtPlotCurve) had been compelling. However, we are directly deriving our own application level marker and slot curve classes from these Qwt classes (which, in general, is a very reasonable thing to do), but there may be many small problems in having the Scalar Slot curve show up as a slot (as we need) rather than as a marker, in the user interface. I think we really are going to have to deploy Scalar Slots as a two-point Slot, and dynamically adjust those end-points as the plot window dimensions change. We already do that sort of thing for plotting Periodic Slots. And we may need to do something special for Date/Time Value scalar slots.
| Estimate (Hours) |
||
| (1) | 6.0 | Slot Plot Client Adjustments (see the 7 enumerated items above). |
| (2) | 14.0 | Creation of a ScalarSlotCurve subclass of possibly SeriesSlotCurve (as is the case for PeriodicSlotCurve), with dynamic adjustment of the endpoints as the window is resized. Special handling may be required for DateTime values (plotted vertically). |
| TOTAL | 20.0 | (estimate: Phil, 9-16-2015). |
--- (end) ---