Plot Page Configuration Revisions / RiverWare 6.7
Phil Weinstein, 1-14-2015 -- Ready for review.
We would like to address two usability problems with RiverWare Plot Pages.
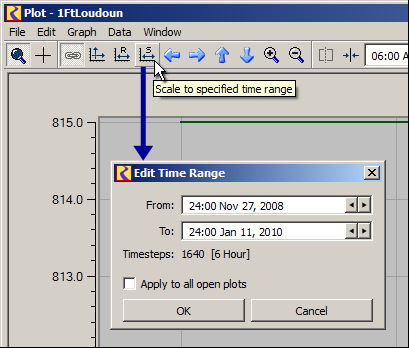
Edit Time Range Dialog
|
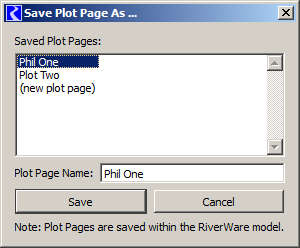
Save As... Dialog
|
Note: We had thought that, when saving a plot page, the current time range (e.g. set with the Edit time Range dialog or other displayed time range adjustment tools) would be retained and restored the next time the plot page is shown. Currently (e.g. with RiverWare 6.6) that doesn't seem to be happening.
When an unsaved plot page is closed (including with the window title bar "X" button), a simple popup dialog is shown asking if the plot should be saved:
... if the "Yes" button is clicked, the "Save As..." dialog is shown. This dialog shows the names of the currently saved plot pages, and allows the user to enter a new name. (See image in previous section). Pressing "Cancel" will do one of the following (TBD):
When a saved plot page (having an assigned name) is closed, its configuration is implicitly saved.
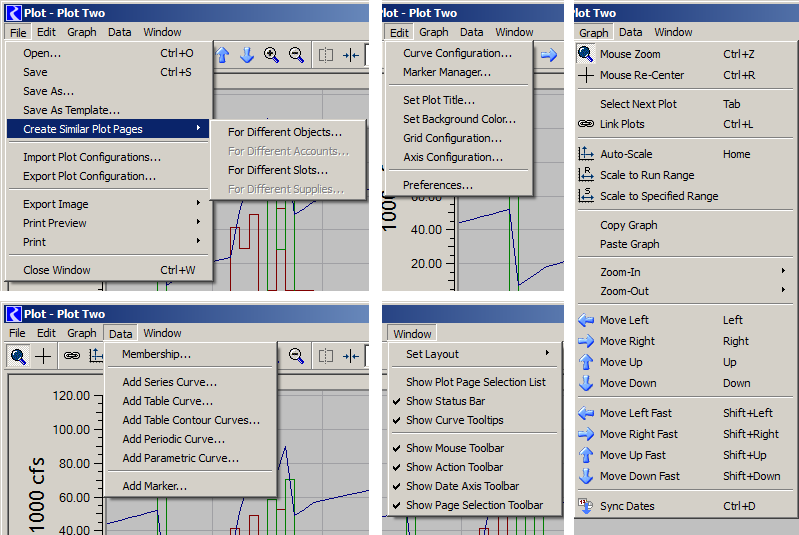
In our discussions about these features, it was suggested that we might be able to remove the "File >> Save" operation from the file menu. Note however that there are several save operations which would still need to be presented. (See the "File" menu screenshot above).
A "Time Range Configuration..." menu item has been added to the Plot Page Dialog's "Edit" menu. That shows the following dialog box.
 |
<<< updated 1-14-2014
|
The primary purpose of this configuration is to determine the time scale of plots on a plot page each time the plot page is shown. It does also provide buttons to apply the selected "scale algorithm" to the currently displayed (non-permanent) time scale of plots.
There are two top-level scaling types selected with radio buttons in panels including associated settings:
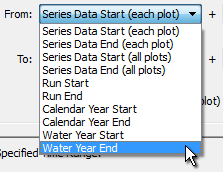
The Symbolic Time Range choice uses one set of settings for all plots on the plot page. The following types of symbolic times can independently be selected for the "From" (earliest) and "To" (latest) times.
*In plot pages containing more than one plot, the "Series Data Start" and "Series Data End" choices are presented as four distinct options:
The "each plot" options consider only the series data within a particular plot for that plot's time range start or end. The "all plots" options use all of the series data among all of the plots for all plots in the plot page.
The Symbolic Time Range panel also shows the resulting date/times and the number of timesteps (based on the model run timestep size). For plot pages having multiple plots, if a "Series Data / (each plot)" option is used, the resulting date/times are shown only for the selected plot, and that is indicated; see the screenshot above.
The Specified Time Range choice allows the specification of absolute date/times for the time range. These date/times are maintained separately for each plot in the plot page, but changes to these configurations can be applied uniformly to all plots by selecting the "Setting for ... All plots on plot page" radio button. The date/times can be directly edited, copied from the system clipboard, or stepped using the date/time spinner controls. There is also a "Set From" drop-down menu button which supports the setting of both date/time values with these functions:
The currently configured scale algorithm can be immediately applied to the plot page's plots with these two buttons:
Apply to displayed time range in: [ All Plots ] [ Selected Plot ]
The user must click the "Save" button to retain the changes made to the time range configuration settings. This also dismisses the dialog. If the "Apply to all open plot pages" checkbox is checked, this configuration data is set on all open plot pages.
--- (end) ---