Trapezoidal Teacups in RiverWare Output Canvases -- Proposal / Nov 2015
Phil Weinstein, David Neumann, Edie Zagona, CADSWES -- edit 11-18-2015.
As introduced in RiverWare 6.6 and also in RiverWare 6.7, Output Canvas Teacup graphics are limited to a vertical rectangular bar presentation. These are typically used to represent volume values within reservoirs.
We would like to provide options to present teacups as trapezoids. Two trapezoid geometry options are being proposed, providing three teacup geometry options altogether (along with rectangular), uniformly applied to all teacups within a teacup group. (Note that an output canvas can have more than one teacup group).
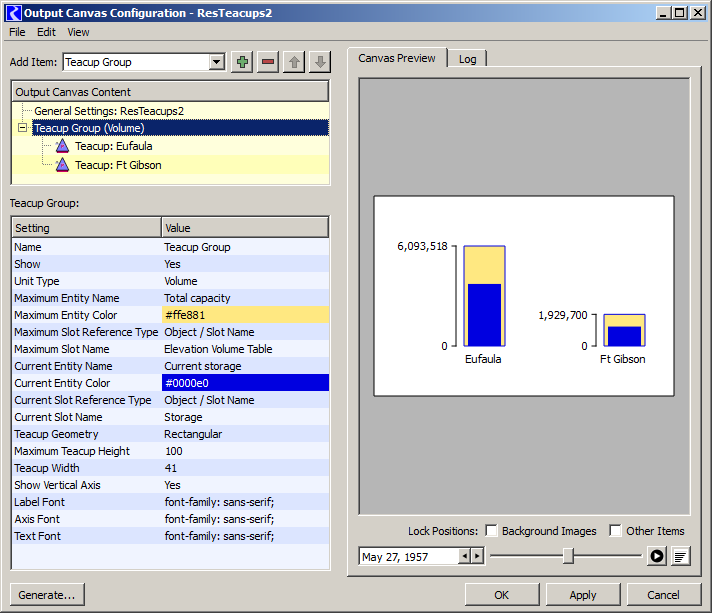
The following screenshot includes a proposed provision for supporting multiple teacup geometries.
In both proposed trapezoidal geometries, teacup values -- typically reservoir volumes -- are linearly mapped to a graphical AREA within the teacup graphic, rather than a HEIGHT above the teacup baseline.
Note that the trapezoidal images in this document are schematic, not actually proportionally consistent with the presented data.

Arguments for the teacup geometry computations are configured at the teacup group level. They apply to all teacups contained in the teacup group. These arguments are specified in units of pixels.
The mapping of numeric values -- typically reservoir volumes -- to pixel measurements is applied with respect to the teacup object (reservoir) having the largest effective "Maximum" value among all teacups in the group. In all three geometries, the drawn height of the largest teacup is the configured Maximum Teacup Height, in pixels.
In the Rectangular geometry, all other teacup values are mapped to a vertical position above the teacup's base, proportional to the value-to-vertical-pixel ratio defined by the largest teacup.
For both Trapezoidal geometries, a value-to-area ratio is computed from the largest teacup and the following pixel arguments. That computed value-to-area ratio is then used for computing geometries within all teacups within the teacup group.
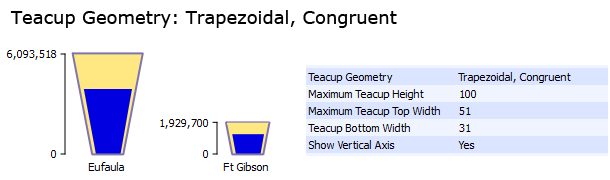
For the Trapezoidal, Congruent geometry, all values are mapped to heights above the teacup base using metrics associated with the largest teacup's geometry. This applies also the top of the trapezoid for all teacups in the group.
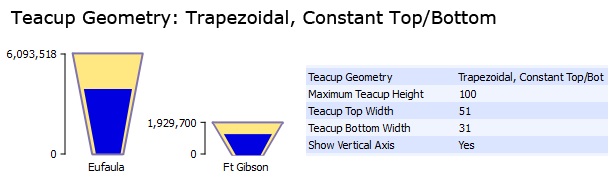
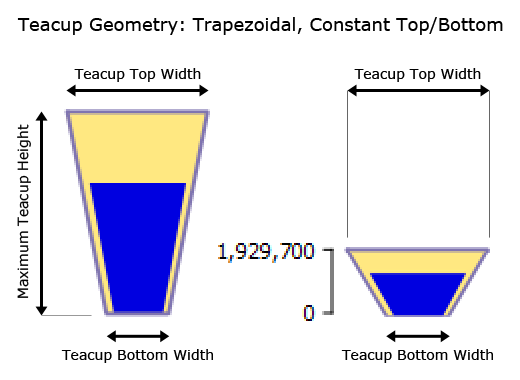
For the Trapezoidal, Constant Top/Bottom geometry, each teacup effectively has its own mapping of values to heights. In this case, the top width of the trapezoid is fixed (specified with the common Teacup Top Width), and the top's vertical position is computed given the value-to-area ratio and the teacup's "Maximum" value. This is done also for the vertical positions of all value-based graphical features with the teacup.
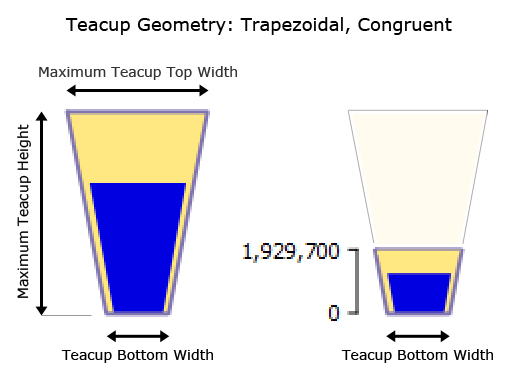
The following diagrams illustrate the fundamental aspects of these computations. The arithmetic applies to what is being shown as the yellow area. (Note that these examples don't include horizontal teacup markers, which graphically imply a value corresponding to the full area below the marker, i.e. within the yellow area). The gaps on the left and right of the blue "current value" regions shown below are technically part of the relevant area. These gaps are hard-coded as a small number of pixels.
--- (end) ---