RiverWare 6.7 Development -- Output Canvas Flow Lines / Feb. 2015
Phil Weinstein, David Neumann, Edie Zagona, CADSWES -- edit 3-18-2015.
- Overview
- Flow Line Group Creation and Configuration
- Flow Line Creation and Configuration
- Flow Line Display Features
- Flow Line Operations
- Flow Line Point Operations
- Setting the Flow Line Group's Maximum Value
- Some Possible Flow Line and Output Canvas Enhancements
(1) Overview
This document describes the Output Canvas' Flow Line capabilities developed through February 2015. This is beyond the Output Canvas capabilities delivered with RiverWare 6.6 which includes Teacups and Teacup Legend, Text Items and Images.
Support for Object Icons was also added as part of this Flow Line development. These are organized in Object Icon Groups and each have an actual associated simulation object (as do teacups). Object Icon Groups support optional dynamic text items which can include values of slots on the object or related data object. This is analogous to teacup text item support.
Flow Line Overview:
- A flow line is a "poly-line" having at least two points drawn on the output canvas.
- A flow line is associated with a particular slot -- typically a series slot.
- Draggable "anchor point" icons are shown for each of a flow line's points when the flow line is selected. The flow line itself is also draggable.
- Flow line groups and flow line creation:
- A set of new flow lines can be added to a flow line group in a single operation using the general slot selection.
- Flow lines are initially placed within the canvas at a location based on the flow line's slot's simulation object within the simulation view. New flow lines initially have two arbitrarily placed points.
- Flow line thickness depicts the absolute magnitude of the slot -- at the output canvas' reference timestep -- relative to all flow lines within the group. The thickness is interpolated using these flow line group settings:
- Minimum Thickness (pixels)
- Maximum Thickness (pixels)
- Minimum Value. Values at or below this value are drawn with the minimum thickness.
- Maximum Value. Values at or above this value are drawn with the maximum thickness.
- Flow line color and line style (e.g. solid or dashed) depict the slot's magnitude -- at the output canvas' reference timestep -- relative to a set of threshold values specific to the flow line. The display attributes for the various intervals are defined uniformly at the flow line group level.
- In the Output Canvas configuration dialog, flow line tree items support these context menu operations: Copy/Cut/Paste/Delete, Move Up/Down, Open Object.
- In the canvas (both the configuration preview and, in some cases, in the output canvas viewer), flow lines support these context menu operations: Open Object, Open Slot, Plot Slot, Configure, Insert Point -- PLUS the following operations on the all flow lines within the containing flow line group: Show Slots in New SCT, Plot Slots, and Configure Group.
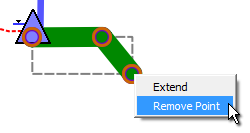
- Flow line point support these context menu operations (configuration preview only): Extend and Remove Point.
(2) Flow Line Group Creation and Configuration
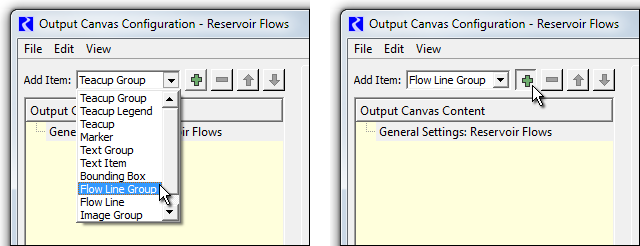
In an Output Canvas (output device) created from the RiverWare Output Manager dialog, a flow line group can be created in these two ways in the Output Canvas Configuration dialog:
- With the "Flow Line Group" item selected in the "Add Item" option menu, and the "General Settings" (top-most) tree item selected within the Output Canvas Content tree, click the green plus ("+") button, or:
- With the context menu on the General Settings (top-most) tree item: Add Item >> Flow Line Group.
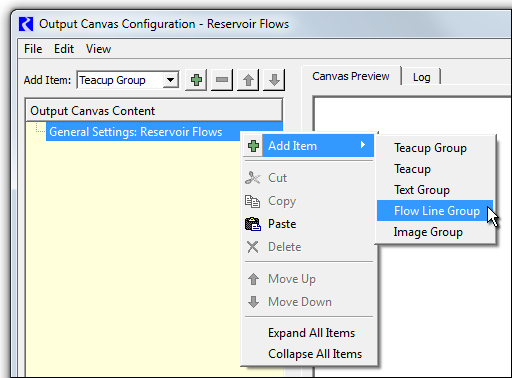
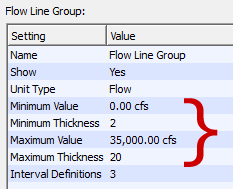
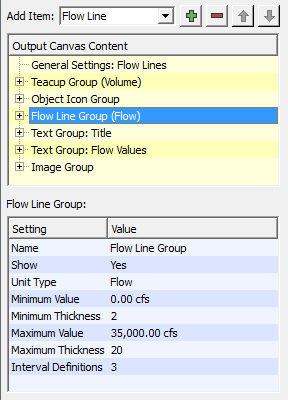
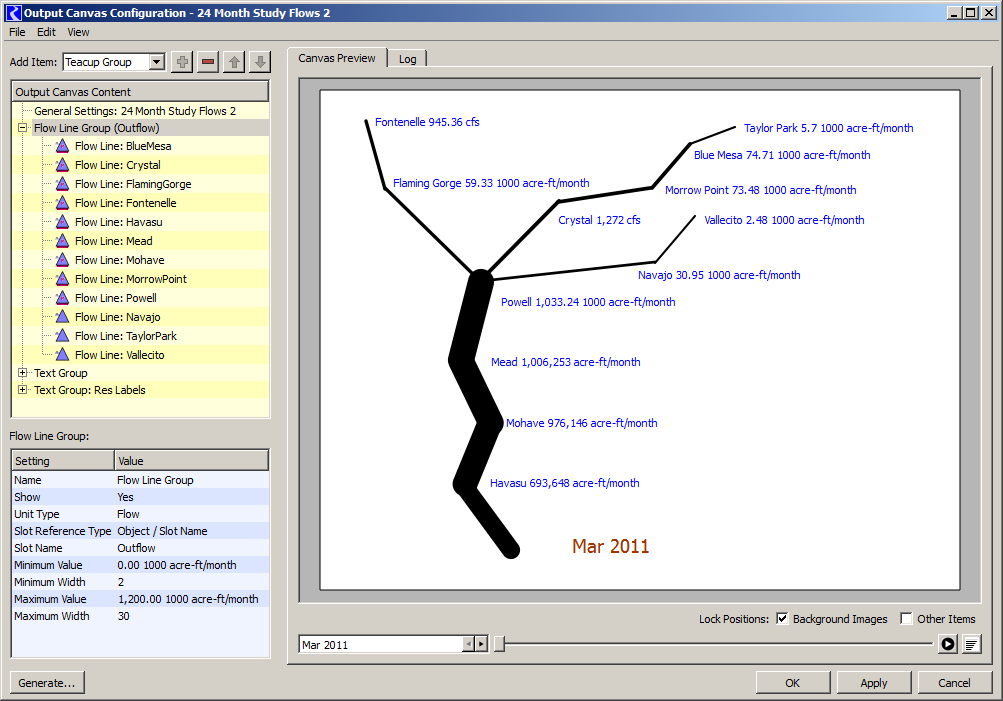
Either of the operations above create a new Flow Line Group item. With that new item selected within the Output Canvas Content list, the group's settings are shown in the settings panel; see image to the right.
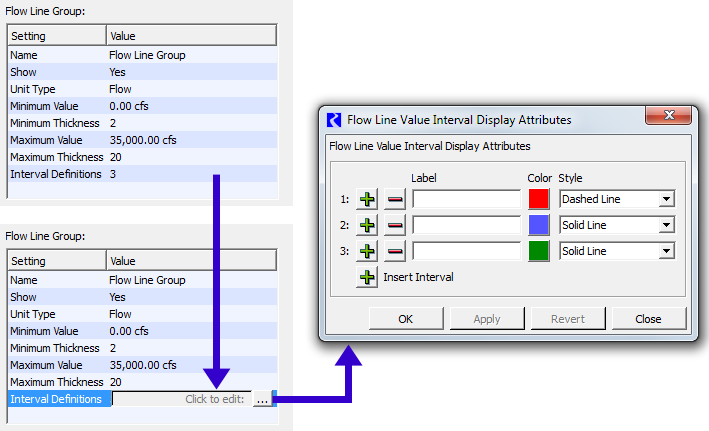
As with all output canvas groups, the Flow Line Group's name and visibility (the "Show" option) can be set by the user.
The slots associated with the flow lines within a flow line group must have the same unit type. Double clicking on the Unit Type value shows a unit type combo box for the selection of the desired unit type; generally "Flow" will be appropriate (the default).
Each flow line's thickness is computed as an
interpolation based on minimum and maximum values and thicknesses.
The maximum value should be devised in relationship to the maximum values (generally,
flows) among all flow lines in the group.
- Note that there is no expectation that all encountered series values will
be within the "Minimum / Maximum Value" range. It's just that flow
line thickness for values outside that range will be "clipped" at
the respective configured Minimum or Maximum Thickness.
- See also the subsequent section on Setting the Flow Line Group's
Maximum Value.
Each flow line's color and line style (e.g. "solid" or "dashed") depends on:
- Display Attributes for a list of value Intervals defined at the flow line group level.
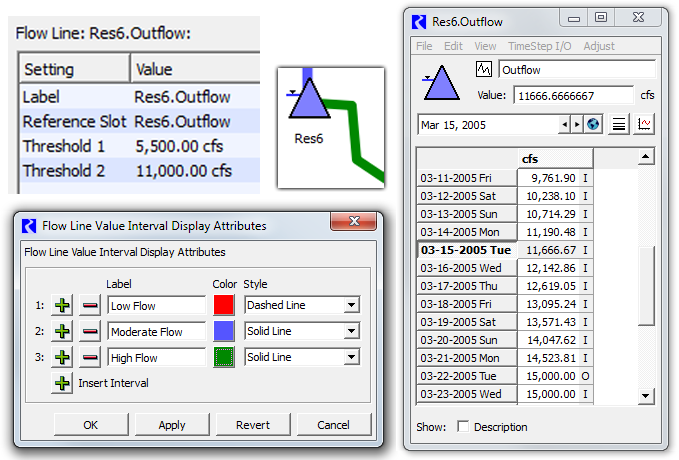
- A set of threshold values corresponding to the boundaries of those intervals, defined independently within each flow line instance.
The "Interval Definitions" setting item indicates the number of intervals currently defined. Double clicking on that item presents "Click to edit:" and an ellipsis button which shows the Flow Line Value Interval Display Attributes editor dialog -- see below. Up to nine (9) intervals can be defined -- for the support of up to eight (8) thresholds. The top interval row in this dialog is for the lowest flow values -- i.e. not exceeding any of a flow line's threshold values. Each interval definition has a text label (which isn't yet used elsewhere in the user interface), a color and a line style. Clicking a color button shows the color chooser dialog. Several line styles are supported -- but note that, in the current implementation, the non-solid line styles look best with thin flow lines, as the size of the dash or dot is a function of the line width.
(3) Flow Line Creation and Configuration
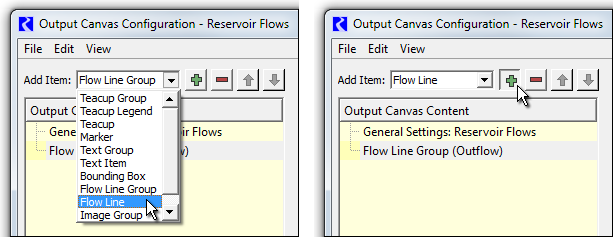
Multiple flow lines can be created within any flow line group in these two ways in the Output Canvas Configuration dialog:
- With the "Flow Line" item selected in the "Add Item" option menu, and a flow line group selected within the Output Canvas Content tree, click the green plus ("+") button, or:
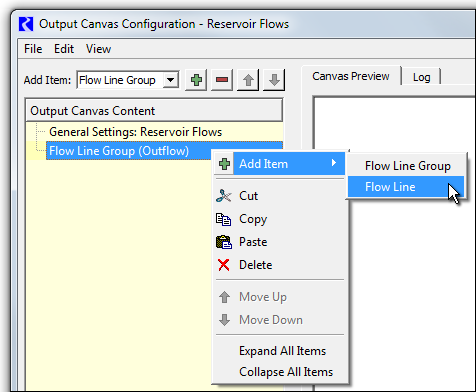
- With the context menu on a Flow Line Group tree item: Add Item >> Flow Line.
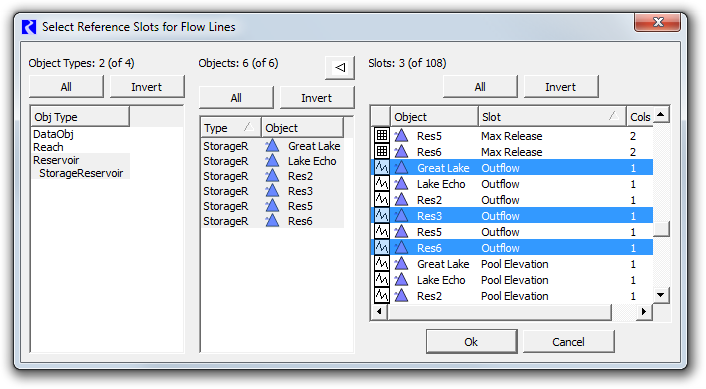
Either of the operations above shows the general (GUS) slot selector. Multiple slots can be selected; a flow line item will be created for each selected slot at a heuristically devised location (based on the location of the selected slots' containing simulation object within the simulation view).
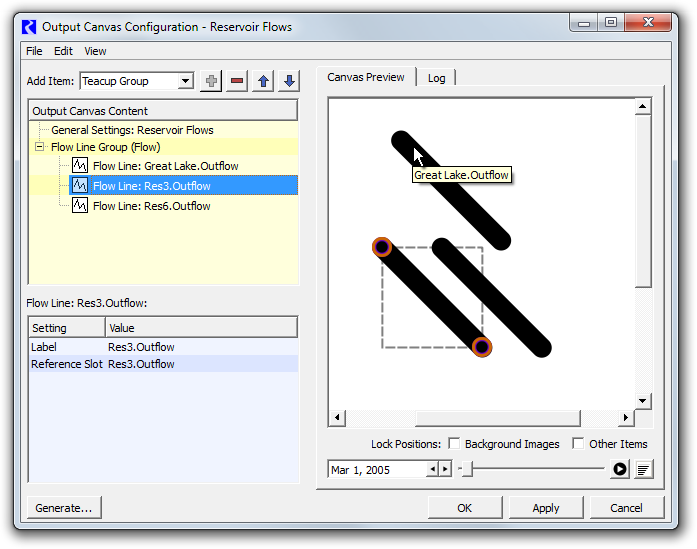
Selecting a flow line either in the Output Canvas Content tree or within the canvas preview causes that flow line's anchor points to become visible. The flow line may be repositioned by dragging the anchor points or the flow line itself. Additional flow line points can be created, and existing points can be deleted, with context menu operations on the flow line and flow line anchor points.
A flow line's Label setting is initialized to the name of the
Reference Slot (from which the flow line was created). The label can
be changed by the user, but it is currently used only within the
configuration dialog's Output Canvas Content tree; the label text does
not currently appear in the Output Canvas.
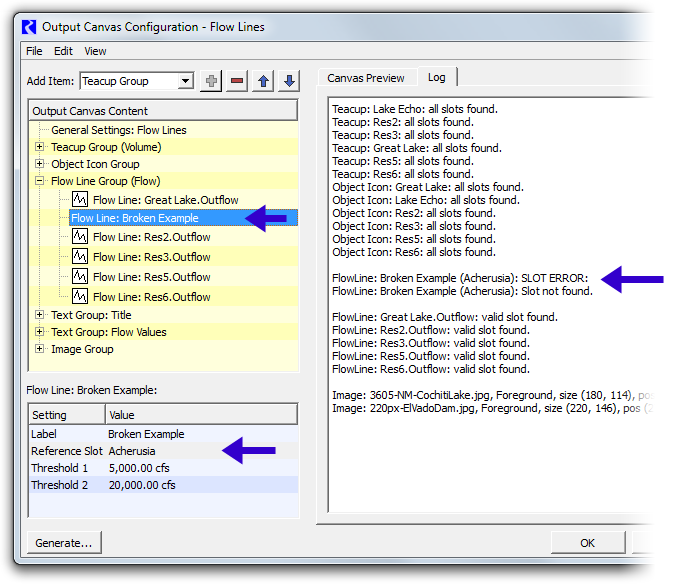
Flow line configuration errors are displayed in the configuration dialog's Log tab. See the example below. Missing slots or slots having the wrong unit type are reported as errors.
(4) Flow Line Display Features
A flow line's thickness is computed from value and thickness interpolation settings defined within the containing flow line group.
| |
| At the current reference timestep, when a flow line's value is ... |
... the flow line is drawn with: |
| Equal to or less than the Minimum Value: |
the Minimum Thickness. |
| Between the Minimum and Maximum Values: |
Linear Interpolation between Minimum and Maximum Thicknesses. |
| Equal to or greater than the Maximum Value: |
the Maximum Thickness. |
|
|
 |
A flow line's color and style are based on which value interval the flow line's current value falls (with thresholds defined at the flow line instance level), and the configuration of that interval's display attributes (defined at the group level).
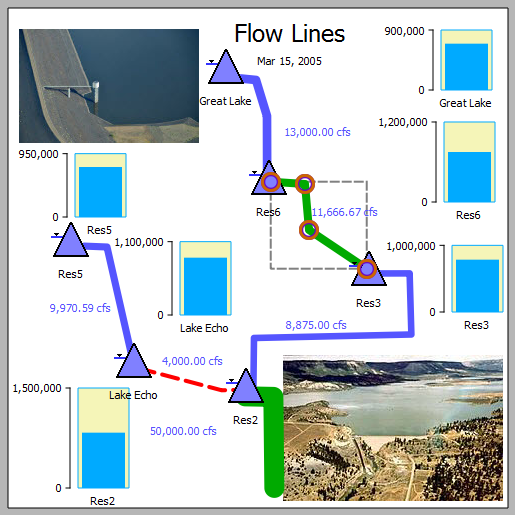
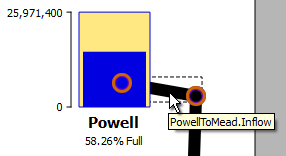
A flow line's tooltip shows the name of the associated slot (generally a series slot, generally having "flow" units).
The single selected flow line has these ornaments:
- A dotted bounding rectangle around the flow line.
- (Only in the canvas preview, with item positions unlocked): donut dingbats with a transparent center around the flow line's control points.
Flow lines are drawn under teacups, object icons and images and canvas text items, though images and the optional bounding box around teacups and object icons can be partially transparent, in which case the flow line will "show through" those items. Flow line anchor points are always drawn on top; see the image above.
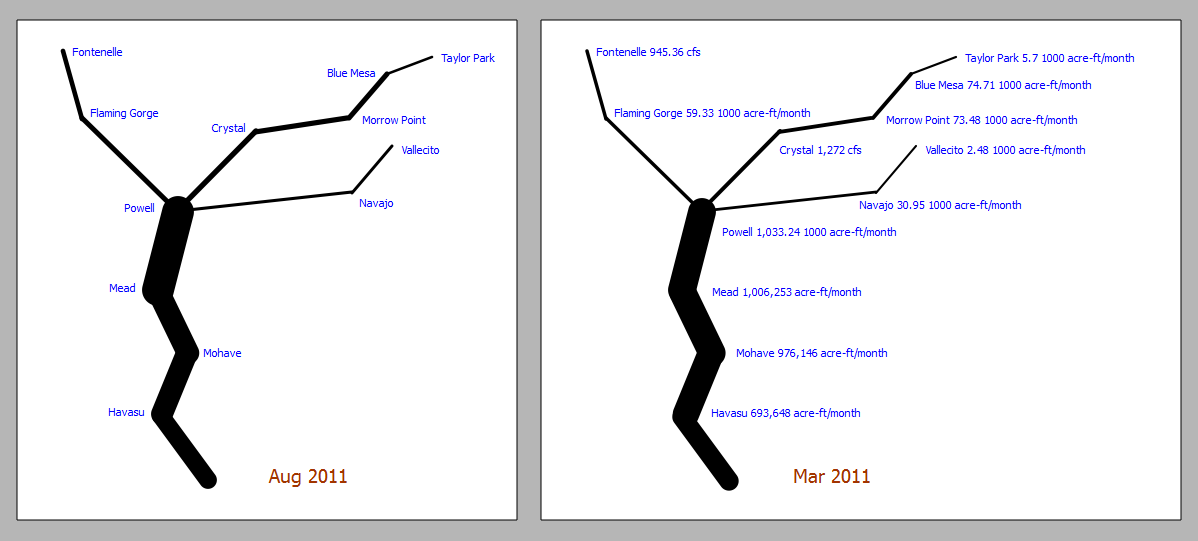
Flow lines don't currently display any text -- neither their label text nor their current value. But text items which refer to the same slots as flow lines can be independently created and placed near those flow lines. See two examples of this below.
(5) Flow Line Operations
Flow lines support a context menu with the following operations.
- Open Object -- show the open object dialog for the flow line's slot's containing simulation object.
- Open Slot -- show the open slot dialog for the flow line's slot (generally a series slot).
- Plot Slot -- show a new plot page with a single plot showing the flow line's slot.
- Configure* -- select the flow line's configuration item in the configuration object tree. This also causes that item's settings to be displayed in the settings panel.
- Insert Point* -- add a point to the flow line at the originally clicked position.
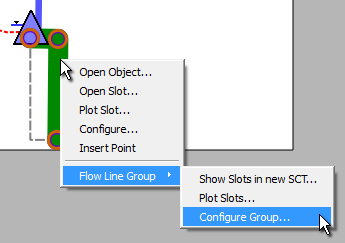
... plus a "Flow Line Group" submenu with the following operations. These operations apply to all flow lines in the same flow line group (i.e. the clicked flow line's sibling flow lines).
- Show Slots in new SCT -- show a new SCT with one column (or row, depending on the default SCT configuration) for each flow line's series slot. See an example of this in a subsquent section ("Setting the Flow Line Group's Maximum Value").
- Plot Slots -- show a new plot page with a single plot with all of the group's flow lines' associated slots.
- Note that, with the current RiverWare plot output device, there is limited support for a set of series slots having different units. Up to two different units can be represented, and those two units are mapped to the two vertical axis (left and right) -- even if those two units are of the same unit type (e.g. cfs and acre-feet/month -- both being "flow" units). So a plot generated from a set of flow lines will be misleading, and possibly incomplete, if the current unit scheme has different display units for the various flow line slots. A warning message will be shown if slots are dropped from the plot because more than two units are already represented.
- Configure Group* -- select the flow line's containing group's configuration item in the configuration object tree. This also causes that group's settings to be displayed in the settings panel. Note that it is at the group level where flow line value interval display attributes (color and line style) are defined.
*These context menu operations appear on flow lines in only the output canvas configuration dialog's preview panel. They do not appear in the output canvas viewer dialog.
(6) Flow Line Point Operations
Flow Line Anchor Points are shown on the single selected flow line -- but only in the output canvas configuration dialog -- not in the output canvas viewer. These points support a context menu with the following operations:
- Extend -- enabled only on the flow line's two end-points -- Add an additional point beyond the clicked end-point.
- Remove Point -- enabled only when the flow line has three or more points -- remove the clicked point.
Note that Flow Line Anchor Points (themselves) are not currently supported as "selectable" objects. Only their containing flow line supports a selection state.
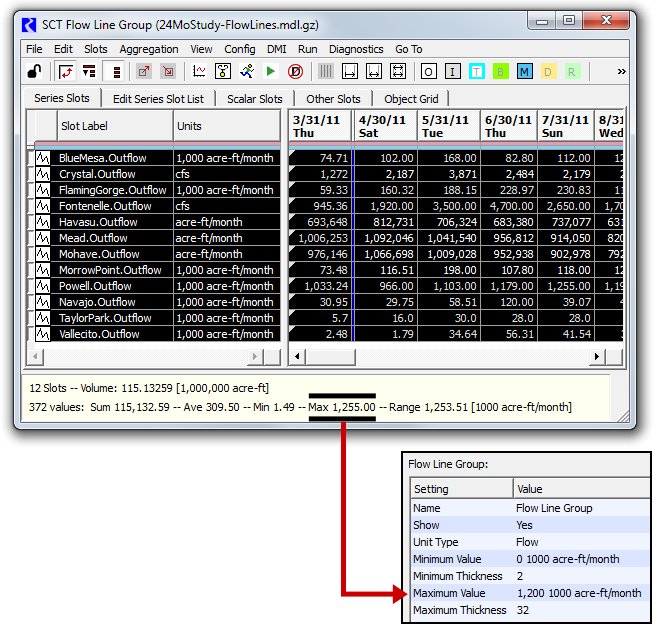
(7) Setting the Flow Line Group's
Maximum Value
As mentioned above, flow line thickness is computed using interpolation settings: minimum and maximum slot values which are mapped to minimum and maximum flow line thicknesses (in pixels). A reasonable minimum value is 0.0. The maximum value should be chosen which exceeds most slot values among all flow lines in the flow line group in the full time series. One way to come up with a good maximum value for a flow line group is illustrated below. This involves these steps:
- From a context menu on any of the flow lines within the flow line group, pick "Flow Line Group >> Show Slots in new SCT...".
- In the resulting SCT, select all cells. (This can be done with a single click in the top-left corner of the series data table).
- In the selection statistics along the bottom of the SCT, notice the "Max" value.
- Enter a number somewhat less than that maximum value in the Flow Line Group's "Maximum Value" settings.
Note: When an SCTs selection includes values with more than one unit (but only of a single unit type), the selection statistics are shown in the first encountered unit. This worked out well in the example illustrated below because the first slot had the desired units ("1,000 acre-ft/month"). The user may have to move a slot of the desired units to the first slot position (SCT row or column) in order to show selection statistics in those units. (It's easiest to change the order of series slots in an SCT by using the Edit Series Slot List tab).
(8) Some Possible Flow Line and Output Canvas Enhancements
Flow Lines
- Anchor point "attachment" behaviors / "snapping" may be desirable.
- Dynamic Text Items on Flow Lines (configured at the
Flow Line Group level) -- with independently
movable text graphics items, positioned relative to the flow line.
(Moving the flow line also moves the text item).
- Note that the examples in this document showing numeric text next to
flow lines use seperate canvas text items (needing to be
configured seperately from their respective flow lines). The suggestion
here is to provide configurable text labels as a high-level flow line feature.
- Defining Flow Line Threshold values with Series and Periodic Slot References. In this initial implementation, a Flow Line's threshold values are defined as constant values right in the Flow Line configuration (settings). There may be a requirement to allow dynamic time-varying values, e.g. guide curves, for a flow line's threshold values -- perhaps for only some thresholds. This enhancement needs further analysis; one concern is the complexity for the user in maintaining a set of slots and slot references used for this purpose.
- Support for AggSeries Slot Column references for Flow Lines. (And possibly, perhaps especially also for Thresholds, as mentioned in the prior item). Currently, AggSeries Slot columns (other than the first column) cannot be depicted as a flow line.
- This would require either the addition of a slot column setting to be used in conjunction with the slot reference (as is done in rwScripts) OR a provision to have the slot reference SLOT_NAME value type rwTextSetting's depolyment of the GUS slot selector enable AggSeries Slot column selection, and to appropriately support AggSeries Slot column selections provided by that selector.
- Option to draw flow lines as multiple lines having different color -- e.g. the individual passthrough account flows associated with a reach. (This would be instead of using color for value interval / threshold depiction).
Output Canvas
- "Callouts" ... reference lines drawn from canvas
objects (teacups, images, object icons, canvas text items, etc.) to
arbitrary locations within the canvas.
- Callouts are poly-lines (two or more points), with graphical support
identical to flow lines.
- A dot or arrow head could optionally be placed at
the callout's head.
- All major canvas items could support an optional
"Callout" child item. (One per object may generally be
sufficient, but supporting multiple callout children would be
easy to do).
- The callout's tail would be attached to
any point within an expanded bounding rectangle around the object --
so moving the object would also move the tail. The user could move
the tail to any point within that rectangle.
- The head would be placed on a particular position within the canvas
-- and maybe effectively attached to a background image location, if the
head is over such an image.
- A technical challenge to be worked out is that it may be important
that the
callout head be drawn at a high "Z" layer and the tail
be drawn at a low layer (but above background images). That can't be done with a single Qt graphics item.
(Ideally, this should apply to the stem at the head, as well as the
head's optional dot or arrow head).
- Inclusion of Pie Chart graphics (output devices).
- Inclusion of Plot Page graphics (output devices).
- Multiple Item Selection, both in the configuration object tree and
the canvas. (The selections should be at least partially synchronized, as is the current
single item selection). The copy/paste buffer (for output canvas configuration
objects) should be expanded to support a list of objects. There are
many potential use cases for this enhancement, including managing multiple
versions of large numbers of output canvas objects.
- The simplest thing to do for the rwSetting panel would be to
display a rwSetting list only when exactly one canvas configuration
node is selected. This would be equivalent to the current level of rwSettingTree
support.
- A more advanced approach is presenting only those settings which are
common to multiple selected nodes, displaying a value only if it is common
to all nodes, and setting all values to a common value upon entry. This
would require enhancements to rwSetting and rwSettingTree.
- Available Animation Rates may be too limited -- especially for long time series. One possibility is adding an "animation frame timestep count" (which is currently, effectively, 1). That is, the number of timesteps to advance on each animation frame.
- Export time animation as video file (e.g. MPEG or animated GIF). This will require
integration with an open source C++ library. We've tentatively identified FFmpeg and an available Qt wrapper:
- Remove or Only Conditionally Show graphics object X and Y Position rwSettings. We may want to completely hide, or else only conditionally show (and not by default) -- the object X and Y Position rwSettings shown for most of the Output Canvas graphical items (teacups, object icons, canvas text items, images). Being able to directly, numerically edit an object's position has some potential benefits, but most of the time these are an unimportant part of an item's editable settings. Here are two potential uses of direct coordinate editing:
- Being able to precisely align and space individual items. We could instead develop graphical tools for doing that -- on the Workspace too. But (on the Output Canvas) we would first have to implement multiple item selection.
- These settings are also useful as a work around in case objects get lost, far outside of the canvas limits.
Teacups
- Support a "Trapezoidal" appearance, as an optional alternative to the current vertical "Bar" appearance.
- One way to do this is to replace the Teacup Group's current "Bar Width" setting with seperate "Top Width" and "Bottom Width" settings.
- Question: Is an option needed for choosing between mapping rendered slot values (Maximum, Current, and Markers) to:
- the vertical distance (height) from the
teacup baseline, or
- the area of the trapezoid below the value.
... without such a user selectable choice, we would probably just
implement the first option.
- Question: should the teacup legend graphic also be given a trapezoidal appearance?
Probably, yes.
- Support an Object's account quantities (generally, storage)
as seperately-colored regions. Both vertical and horizontal slices have
been suggested. (We might consider supporting this for only
"Bar" teacups -- not "Trapezoidal" teacups).
A teacup legend solution should also be included.
There may be related multiple-region use cases not
related to accounts. (This whole feature-area needs more requirements analysis).
- Remove explicit Slot Reference Type rwSettings -- i.e. "Object
/ Slot Name" vs. "Data Object / Slot Name". We could just automatically
search both (when defined and valid) for the required slot name. (This is
currently the most confusing setting type among the various output canvas
configuration objects). This provision is slightly less expressive: it wouldn't be possible to use a slot on the associated Data Object which had the name of a physical slot on the reference object (e.g. "Outflow").
- It may be desirable to support the specification of a teacup's maximum
value as a teacup setting.
- The current default algorithm obtains the maximum volume value
from the "storage" column in the last row of the object's Elevation Volume
Table slot (if the object has such a slot, as do reservoirs). The problem
with this is that, for numeric stability, that table is often significantly,
arbitrarily extended.
- The practical alternative is to provide the object's maximum value in
a user scalar slot on a data object associated with the reservoir object. That's
a lot of work for the user, and unless there are other potential uses
for that Max Storage value, it would be simpler for the user to configure
that right in the teacup.
- Note that the maximum value is displayed in the teacup graphic,
so its value can readily be confirmed by the user.
- Technical: A direct way to support this would require an rwSetting
enhancement outlined below ("rwSetting conditioning should be extended
to a parent node's rwSetting list"). This is needed at least to make available the teacup group's configured unit type to the setting tree for each teacup.
Text Groups
- Text Groups could have an option to force all slot values to be displayed
with the current unit scheme's default display attributes (units and precision)
for the value's unit type -- instead of the display attributes specifically
configured for the particular slot.
- The lack of that option (or only implemented behavior) shows up in Reservoir
Outflow flow lines in the 24 Month Study regression test example. Notice
that there are three
different scale/units represented in the text items shown in this
screenshot -- cfs, acre-feet/month and 1000 acre-feet/month -- http://cadswes2.colorado.edu/~philw/2014/TeaCup/Dec2014/2014-12-26/FlowLinesText-24MonthStudy.png
rwSettings (technical)
- rwSetting conditioning should be extended to a parent node's rwSetting
list -- i.e. not just limited to the sibling settings within the same
node. The rwSettingTree constructor could be passed a 2nd rwSetting list for
rwSetting conditioning. It might be sufficient to pass just that 2nd list
to rwSettingTree editor widget constructors, and to all rwSetting methods
which take a "siblings" list.
Such conditioning is currently used for:
- conditionally showing an rwSetting, based on the value of a "sibling"
rwSetting.
- retrieving display attributes (units and precision), based on the value
of a "sibling" rwSetting for either a slot instance or a unit type.
Plots
- As mentioned in the description of the "Flow Line Group >> Plot Slots" context menu operation, if more than one unit is represented among the set of slots being plotted, the second unit is plotted along the right-side axis, and slots having neither of the two first units are dropped from the plot. This happens even if various represented units are of the same unit type! Note that when two units having the same unit type are represented, the vertical scales are unrelated, so the plot data is very misleading. This is exacerbated by the fact that you can't tell which curves (slots) correspond to which vertical axis (left and right). We should consider folding all slots having the same unit type into a single vertical axis using one of the represented units -- perhaps giving preference to the default unit for the particular unit type with respect to the currently active unit scheme.
--- (end) ---