Estimates for USACE SWD / Phil Weinstein / July 2015
Initial draft ready for review: 7-14-2015
Task estimation billing: USACE Tulsa user support.
|
Estimate (Hours) |
|||
| 1 | Export charts as a movie. (Mostly: development of animation video file creation capability, applicable to other timeseries-based graphics, e.g. Output Canvas). | 48.0 | ||
| 2 | Automatically scale plots to the run range and reset plot extent when the run range changes. | 52.0 | ||
| 3 | In the SCT allow for predefined coloring of cells or fonts, when the value is over or under a certain threshold. | 92.0 | ||
| 4 | Ability to set the DSS file for the DMI in the Script Manager/Dashboard. | 12.0 | ||
We will need to make use of an additional open source library to support the genertion of video files (e.g. for MPEG, AVI, MNG or MOV file formats). The good choice for use with Qt is FFmpeg. This will need to be integrated into the RiverWare build. Programmatically, the animation is generted one frame at a time, for the sequence of timesteps to be represented in the video. Configuration information common to all basic time series animation video generation applications within RiverWare will be encapsulated in a reuasable class (e.g. time range, frame rate, number of timesteps per frame, generated video format and output file path).
Technical References:
| Hours | Task | Description |
| 12.0 | 1.1 | Acquisition of FFmpeg and Qt FFmpeg Wrapper source, build, and integration of generated libraries into the RiverWare build. |
| 12.0 | 1.2 | Development of configuration information data model and configution editor GUI. |
| 16.0 | 1.3 | Video file generation implementation |
| 8.0 | 1.4 | Final testing, revisions, and feature documention. |
| 48.0 | TOTAL |
This will be an adaptation of part of the proposal documented here:
We won't attempt to address the first (of 2) "motivations" -- the edit-state/save algorithm. That is, as with all plot page configuration changes, the user will still have to explicitly "save" the plot page in order for the configuration changes to persist. Only the "Time Range Configuration" enhancement will be addressed with this development.
We will likely make changes to the design modification described here. This is intended mostly to gage the "scope" of development. Tentatively, that documented design cited above will be adjusted as follows:
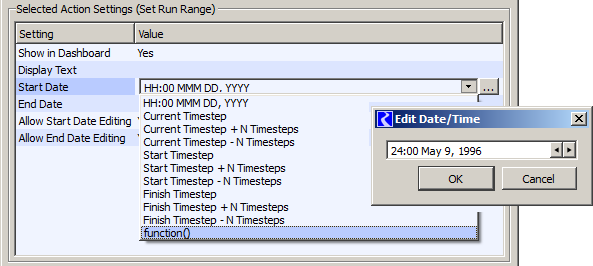
A significant difference is that, for the "From" and "To" date/times in the Symbolic Time Range, we will use a customized version of the symbolic RPL Date/Time Editor, as is implemented, for example, for the "Set Run Range" Script Action, shown here in the context of an rwSettingTree:
Note: The last symbolic date/time type option shown above is "function()" -- that's a RPL Function having a DATETIME return type.
Since this RPL Date/Time Editor widget supports both absolute timestep date/times and a variety of symbolic ones, there will be no need for a higher level distinction between the "Symbolic Time Range" and "Specified Time Range" choices. However, these additional options will be added (and internally encoded seperately from the RPL Symbolic Date Time values):
For single-plot plot pages:
For multiple-plot plot pages:
| Hours | Task | Description |
| 20.0 | 2.1 | Custom adaptation of rwSettingTree::RplDateTimeEditor, deployable outside of rwSettingTree, and including also the Series Data Start/End options. As with the RPL Symbolic Date/Time values, the "+ N Timesteps" clauses are editable, and need to be interpreted outside of the normal RPL Symboic Date/Time editor value processing. |
| 8.0 | 2.2 | Enhancement to the Plot Page data model to support this new configuration data. |
| 8.0 | 2.3 | Implementation and managment of the overall "Configure Plot Page Time Range" dialog box. |
| 10.0 | 2.4 | Manually applied application of this time range configuration data to the selected plot, or all plots within the Plot Page. |
| 6.0 | 2.5 | Automatic application to the plot page when the plot page dialog is shown. |
| 52.0 | TOTAL |
The following design is tentative. It is intended mostly to understand the scope of complexity for support of these enhancements.
This set of enhancements applies mostly the the SCT's "Series Slots" tab, but also addes provisions to the "Edit Series Series Slot List". When "Override cell coloring" (tentative name) is enabled for the SCT, individual series slot items in the Series Slot tab can be made to use a different color scheme -- i.e. other than the indication of time series timestep flag values.
The current columns in the Edit Series Slot List tab's treeview are:
But when "Override cell coloring" is enabled, the following columns also appear.
A "Color Override" tab will be added to the SCT Configuration dialog (which currently has eight tabs). (We might choose to do this is a seperate dialog). This presents color and tooltip configurations for each of the override colors -- one per row, layed out in a table:
The following columns appear:
In the Series Slot tab, for slots for which Color Override has been enabled, a Custom Color Override submenu (of a design TBD) will be used to assign or clear Custom Override Colors to the set of selected cells.
NOTE (needs review): Since cell color override assignment is specific to the SCT (of which there can be several used for a given model), the slot / timestep cell association with particular overrides will be stored IN THE SCT configuration (in the saved SCT configuration). This may not be very meaningful for SCTs which are used with more than one particular model.
| Hours | Task | Description |
| 24.0 | 3.1 | SCT Configuration Data Model Enhancements, including Flex/Bison-based (parsed) serialization: (a) Slot Item attributes, (b) Override attributes (Alerts and Custom), (c) Timestep/Custom Override association map. |
| 24.0 | 3.2 | Edit Series Slot List Tab: three conditionally shown, editable, columns. Whether this remains a QTreeWidget (which it probably would) or is changed to a QTreeView, supporting editing in row-item cells is somewhat complex. |
| 20.0 | 3.3 | Color Override attributes configuration editor: Lower, Upper, Custom. |
| 8.0 | 3.4 | Color Override / Cell assignment operation (with tooltips on cells, applies to whole cell selection). |
| 8.0 | 3.5 | Cell rendering enhancement to implement override cell coloring |
| 8.0 | 3.6 | Post-development review revisions. |
| 92.0 | TOTAL |
Since the two types of rwSettings needed for this new action already exist -- i.e. a DMI selector and a File Path selector -- and since provisions are already in place to circumvent limitations imposed by the "edit object" arcitecture for relevant objects, implementation of this new Script Action type should be relatively straighforward.
| Hours | Task | Description |
| 12.0 | 4.1 | Set DMI DSS file script action. Configuration/Data Model support (using primarily rwSettings) and Execution. |
| 12.0 | TOTAL |
---