Gnats 5405: Diagnostics sometimes cause the RiverWare interface to freeze
RiverWare 6.5, Analysis, May 2014 -- Phil, Edit 5-23-2014 (b) -- Gnats Record -- Initial Writing In Progress.
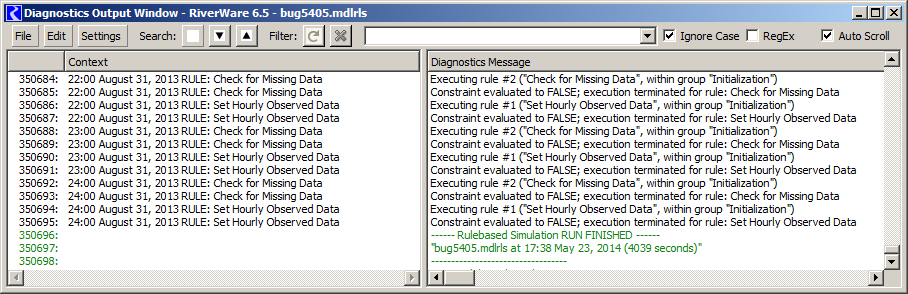
The provided bug model and Patrick's original bug description are quite good. I was able to reproduce both execution behaviors and effectively examine them with Visual Studio 2010 Premium's performance analysis tools using the CPU Sampling method. The model, provided by Steve, has 14616 hourly timesteps.
The two distinct scenarios are:
With Informational Diagnostics disabled in this bug model, the run completes in about 35 seconds in both cases. This is with a debug build of RiverWare 6.5 development on my 64-bit Dell Optiplex 990 Windows 7 development machine. Certainly a part of the difference (35 seconds vs. one hour) is due to the generation of the diagnostic message text. But performance analysis showed that, given the very large number of generated messages (over 350,000), about 90% of the time is due to the implementation of the GUI message list.
An "optimization" within the QAbstractItemView base class to defer processing when the view is not visible (in a hidden dialog) is ending up taking virtually all of the time repeatedly canceling and rescheduling a timer. This happens each time a notification from the QAbstractItemModel, to the QTreeView, of rows being added -- i.e. with every new diagnostic message.
void QAbstractItemView::rowsInserted(const QModelIndex &, int, int)
{
   if (!isVisible())
      d_func()->fetchMoreTimer.start(0, this); //fetch more later
   else
      updateEditorGeometries();
} |
The lower-level culprit is this method which is involved in canceling the timer. The items in the thread's "postEventList" is steadily growing. After about a minute, the list had over 150,000 events (from which we are trying to remove just the ones associated with the timer being cancelled). Apparently, events are piling up faster than they can be processed or removed -- so we never get to any of the "user input" (e.g. mouse) events. The GUI is frozen.
void QCoreApplicationPrivate::removePostedTimerEvent(QObject *object, int timerId)
{
QThreadData *data = object->d_func()->threadData;
QMutexLocker locker(&data->postEventList.mutex);
if (data->postEventList.size() == 0)
return;
for (int i = 0; i < data->postEventList.size(); ++i) {
const QPostEvent & pe = data->postEventList.at(i);
if (pe.receiver == object
&& pe.event
&& (pe.event->type() == QEvent::Timer || pe.event->type() == QEvent::ZeroTimerEvent)
&& static_cast |
The general slowness is just due to the inappropriateness of the Qt item model/view architecture for a list (flat QTreeView) with such a huge number of rows. Performance progressively slows, especially for adding new rows to a list already having over 200,000 rows. Nothing particularly stands out -- it's just the basic QModelIndex machinery which doesn't scale well (as a model/view implementation should).
Virtually all of the time is spent in QTreeView::doItemsLayout(), called from a "delayedLayout" timer. We get down to a low level where time is distributed between basic Qt item model/view functions -- components of a total of 87% for that method ...
Basically, the architecture based around QModelIndex is WAY overly generalized to support all sorts of data topologies. It's unfortunate that a flat list has to go through all of that. At some point, we will probably want to bail from use of this general Qt item model/view list (flat tree view) for diagnostics messages.
I did ask Patrick to talk me down from taking that on now -- that is, implementing a display list from scratch. Especially if we stuck with constant-height rows, it would generally be a simple matter to just do our own item "painting" in a QWidget inside a scroll area (QAbstractScrollArea). The thing is, we would have to take care of a number of features ... tooltips, context menu, eliding, row selection state. Patrick suggests doing some research to see what other groups have done for this sort of requirement.
However, as correctly described in the bug report, a slow-down when the Diagnostics Output Window is shown (Scenario 2) is a smaller problem than a slow-down -- and GUI FREEZE -- when it isn't shown (Scenario 1). I propose we address Scenario 1 now, and continue to look for better tools for the list implementation (i.e. other than the Qt item model/view classes).
... writing in progress.
---