Tea Cup Reference Example
A visual tool on the California Department of Water Resources website provides a good example of the sort of Reservoir Tea Cup graphical element we would like to create.
RiverWare Animated Tea Cup and Flow Elements: Requirements Analysis
Phil Weinstein, CADSWES, 7-30-2014
| RETIRED EARLY DRAFT ... REFER TO PROJECT INDEX |
This document explores some initial ideas for a new animated data visualization tool in RiverWare to depict reservoir levels and relative flows. This new display will incorporate two dynamic graphical elements depicting various quantities at one moment in time:
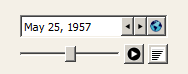
A timestep slider with animation controls will allow the user to move these graphical elements to a new timestep within a designated time range, and optionally automatically step that timestep forward at a settable rate (as an animation or slide show).
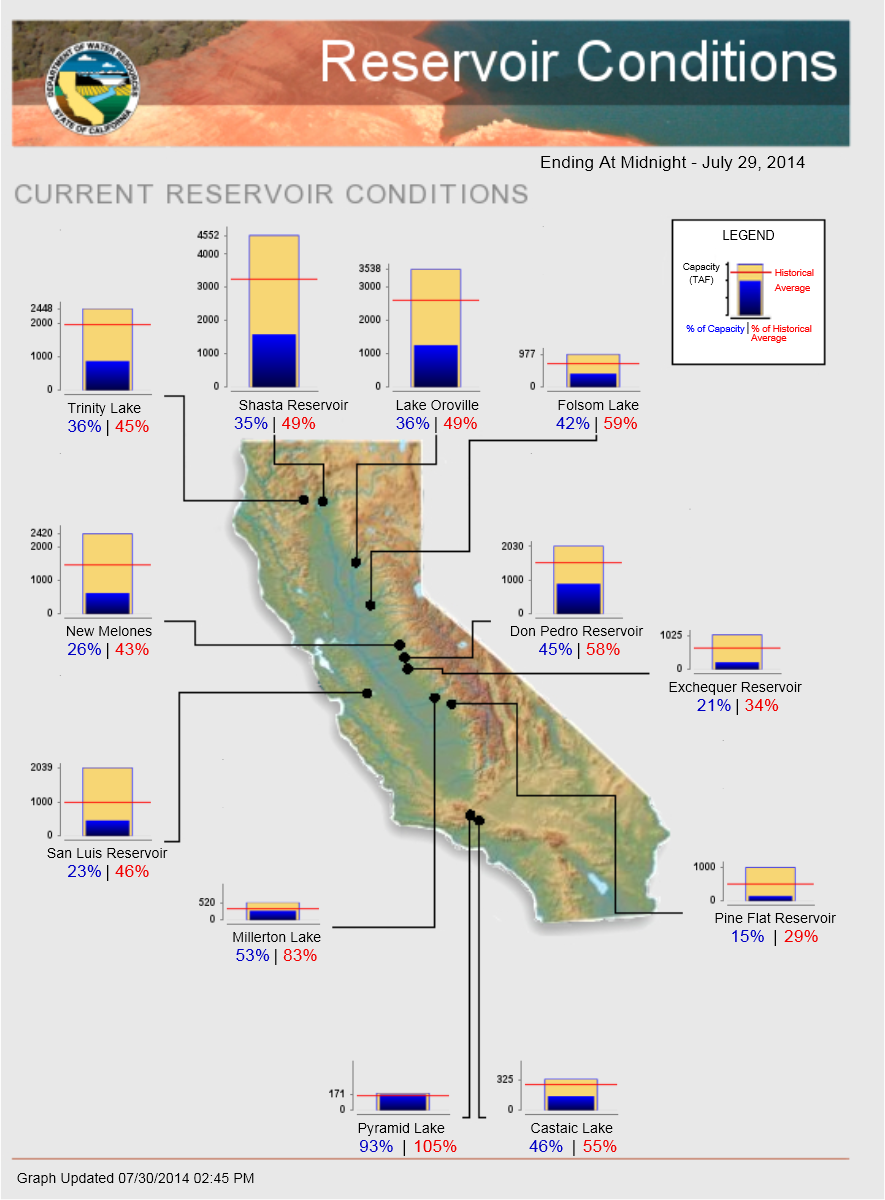
Tea Cup Reference ExampleA visual tool on the California Department of Water Resources website provides a good example of the sort of Reservoir Tea Cup graphical element we would like to create. |
|
|
|
||
| Source: http://cdec.water.ca.gov/cdecapp/resapp/getResGraphsMain.action | ||
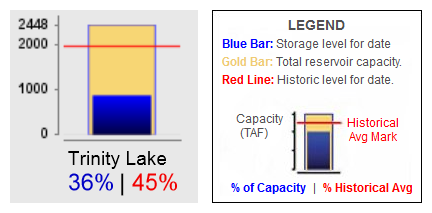
This visually depicts these quantities:
The Tea Cup element also includes these text / numeric items:
The full map image depicts "callouts" -- lines connecting the tea cup image to a particular point within the map. (We will not be implementing this feature).
In the CDWR graphic, most reservoirs seem to share a common vertical (volume) scale. But some smaller-capacity reservoirs have a larger scale (e.g. see Pyramid Lake at the bottom of the graphic).
One Tea Cup element can be shown for each reservoir in the model, optionally shown or hidden. Tea Cup elements can be dragged by the user to a new location within a Tea Cup View (see below).
Note: This proposal is for support of these three specific reservoir volume quantities: capacity, current storage, and historical average storage. A more generic approach is also possible -- allowing the user to provide labels and data sources for: (1) full value, (2) current value, (3) marker value. It's not clear that that level of generality would be preferable. A compromise would be to treat only the marker value generically, e.g. for a guide-curve value instead of historical average -- this possibility is not explored further in this document.
General Reservoir Tea Cup configuration settings for all tea cup elements in the model include:
Reservoir Tea Cup instance configuration settings include identification of the data source for these features:
|
In addition to those instance configuration settings, tea cup instances support the following persistent state information:
Other RiverWare Tea Cup element provisions:
The second type of graphical element shown in Tea Cup Views is the Flow Element. (This is not depicted in the Tea Cup Reference Example, above). These are drawn as lines having a width, color and pattern indicating the magnitude of a flow value at a particular point in time.
Either end of a Flow Element can be "snapped to" a Tea Cup Element, or can be independently placed anywhere within the Tea Cup View. We will need to devise mouse interaction techniques for disambiguating the action associated with clicking and dragging a Tea Cup element or a proximate Flow element. Flow elements will need two or three draggable "hot spots" for positioning -- one at either end, and possibly a third in the middle for geometric translation (moving) which could also "un-snap" the Flow Element from Tea Cup Elements.
A Flow Element will have a reference to any single Flow-units series slot in the model. The current magnitude of the element's flow series (at the reference timestep) will be depicted in three ways:
General Flow Element configuration for all flow elements in the model includes:
Flow Element instance configuration settings include:
In addition to the instance configuration settings, flow element instances support the following persistent state information:
Other RiverWare Flow Element provisions:
An obvious approach is to show Tea Cups either in their own new RiverWare Workspace View or as a special mode of the existing Simulation (or maybe Geospatial) Views. However, we have decided to present Tea Cup Views as a new kind of Output Device so that muliple instances could be defined within a single RiverWare model. This would be a graphical Output Device, similar to a Plot Page or Pie Chart, and would, in fact, present the same timestep slider / animation control as currently supported for Pie Charts:
 |
Even if deployed as an Output Device, the Tea Cup View would be "workspace view-like" in that simulation objects (reservoirs) would be represented as selectable, draggable graphical objects shown on top of an optional background image.
The Tea Cup View supports:
--- (end) ---