This document describes enhancements to RiverWare Pie Charts developed in April 2014 for RiverWare 6.5
|
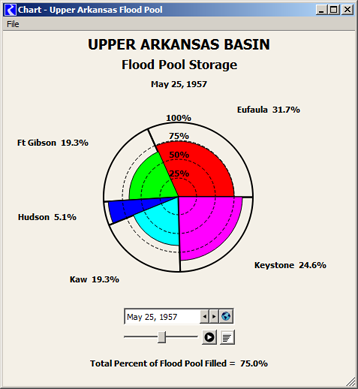
Pie Charts are provided in RiverWare as the "Chart" Output Device. They are configured in a configuration dialog box. Within the Pie Chart dialog (which shows the actual pie chart graphic) a date/time spinner is used to specify the reference timestep for series data displayed in the chart. The chart can be printed or exported as an image file.
With a previously development enhancement for RiverWare 6.5, pie charts can be included in RiverWare model reports.
The following topics are described in subsequent sections in this document.
Pie charts showing series data (various kinds of RiverWare series slots) depict only one timestep at any given time. Timestep animation automatically advances the pie chart's reference timestep at a constant rate. New controls associated with the pie chart's date/time spinner support this type of animation.
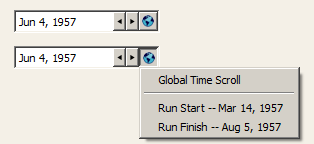
Apart from the Pie Chart enhancements described in this document, relevant enhancements were made also to the RiverWare date/time spinner.
|
 |
|
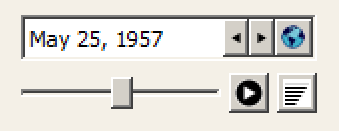
A new row of controls below the pie chart's date/time spinner support animation.
The following frame periods are supported:
|
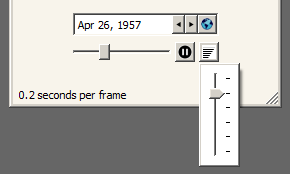 |
(The latter three rates provide the experience of a "slide show" rather than an animation as such, but no technical distinction applies).
The animation stops when any of the following occur:
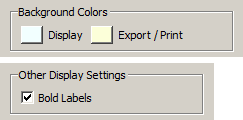
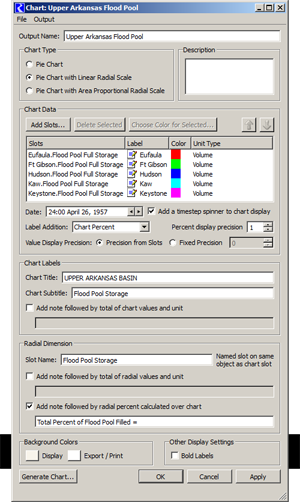
(2) New Display Options:The Pie Chart configuration dialog supports three new configuration settings.
Clicking on the background color buttons brings up a color chooser dialog. (3) Other Display Changes:Numbers shown in the pie chart are conditionally shown with comma separators (depending on RiverWare's global "Show Commas in Numbers" setting). Radial scale circles (25%, 50%, 75%) are now dashed -- not solid lines. Optional summary statistics are now horizontally centered, rather than being shown in the bottom left corner. |
 |
Only one pie chart dialog is shown for any particular pie chart (output device) instance. Clicking "Generate" or "Apply" from the output manager or a pie chart configuration dialog just updates the corresponding pie chart dialog -- instead of showing a redundant one.
The pie chart dialog's visibility (e.g. "minimized" state) is now independent from the output manager and pie chart configuration dialogs.
The pie chart's auto-sizing and centering has been improved. Better image "stability" was needed especially for the new animation feature.
The Gnats 5483 pie chart crashes have been fixed for RiverWare 6.4.8 and 6.5 (development). These two crashes had been readily reproducible in both builds:
The following components and technical enhancements were developed in the course of implementing the pie chart enhancements.
(A) DateTimeSpinSlider is a new composite slider control (with two icon buttons) which can be "attached" to any RiverWare date/time (timestep) spinner. The slider thumb provides an alternative way of changing the timestep value, and also graphically conveys the timestep value with respect to the full time series range. This widget is also an "animation generator" which periodically advances the date/time (timestep) spinner. Included is a Play/Pause button and a popup slider control to select the animation speed. The placement of the DateTimeSpinSlider within a widget layout is up to the client (dialog box) -- so it could be next to the date/time spinner instead of below it (as it is in the Pie Chart dialog).
(B) The Pie Chart animation speed control is an example of popping up a QFrame containing a QSlider from a push button. (The QFrame is helpful for the appearance of the slider, but it is also a place where additional controls could be provided).(C) Technical: The DEVICE_DELETED callback from objects in the cwOutputDevice class hierarchy (all of the RiverWare output devices) can now be generated from the most-derived class' destructor. This insures that all subclass instance data is intact when that callback is received. This enhancement was helpful in resolving part of the Gnats 5483 dysfunctions described above.
---(A) Support for pie charts in RiverWare model reports was developed in November 2013. The "Chart" report item type is a reference to an existing Chart output device (defined within the RiverWare model). This is included in a generated Model Report as a reference to a generated chart dialog image file built from the referenced Chart output device configuration. The width and height of the generated image are specified within the report item's settings.
(B) The pie chart configuration dialog's slot list now supports copy/paste as context menu operations. Slot references can be copied to or from the RiverWare slot clipboard. When copying slot references, their full names are also copied, as text, to the system clipboard.