The Hydrology Simulator will take observed streamflow values and synthesize an ensemble of flow data for a user specified number of traces. These trace flow files can then be imported via a DMI to a RiverWare multiple run. The scripts to generate hydrology ensembles use the R Project for Statistical Computing program, so R must be installed on the user's computer (R Installation Instructions).
The Hydrology Simulator has three functions to choose from for generating ensembles:
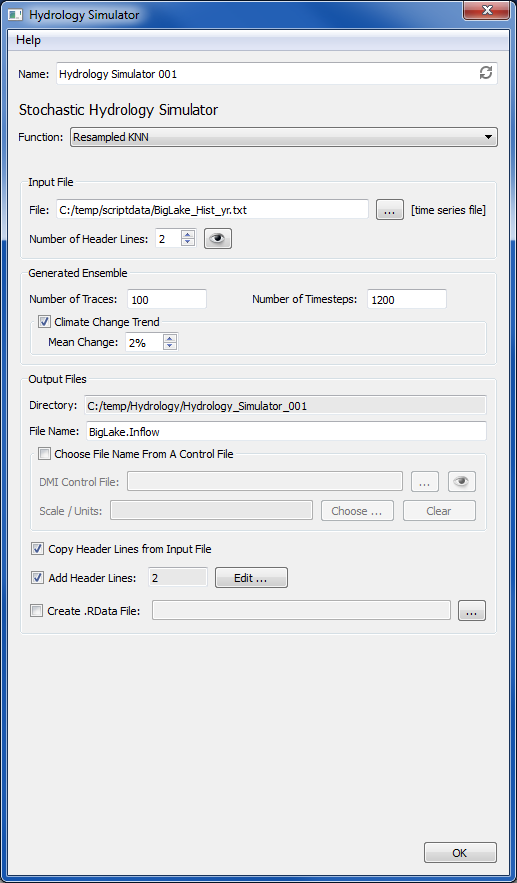
When the Hydrology Simulator plugin is configured, a user interface is presented where the user gives the plugin a unique name. Other general controls are the Help menu item at the top that will bring up this help file, and the OK button at the bottom that will save the configuration and dismiss the dialog. The user can select the desired function from a drop-down list. The following sections discuss the user interface presented for each function.
In
the Input File frame, the user can type in a file name or select a file
via the file chooser button. This file is a single time series of
observed historic flows for the desired site. The R scripts expect that
the file will start with data values, so if there are non-data header
lines in the file, the number of lines to skip needs to be specified by
the user with the Number of Header Lines spin box. The eye icon will
bring up a viewer showing the file (if the file exists) allowing the
user to see what header lines are present.
The Generated Ensemble frame contains controls to configure ensemble information. The number of traces to generate in the ensemble and the number of timesteps to put into each trace are specified here. The optional Climate Change Trend control allows a positive or negative percent change to be applied, so that over the course of all the timesteps in the trace, values will trend up or down by this percent.
The Output Files frame contains a number of controls for specifying output generated by the plugin. The output directory is determined by the study manager and is displayed as read-only here for information purposes (this directory is named with the name of the plugin and is located under the Hydrology subdirectory of the study's directory). A directory for each trace, named trace1, trace2, etc., will be created under the output directory. The File Name is the name that will be given to the resulting output file generated in each trace directory. This name (typically a site name) can be typed in by the user, or optionally selected from a RiverWare DMI control file. If this option is chosen, the DMI Control File name can be typed in or chosen with a file selector button. The eye icon will allow the user to view the entire control file. The Choose... button brings up a list of the slot names present in the control file and the user can select one that will be populated to the File Name line. If the slot has units specified in the control file, the Scale/Units line will also be populated (this is for informational purposes only and has no impact in changing the ensemble calculations). The Clear button will clear out entries in the File Name and Scale/Units lines.
The remaining controls in the Output Files frame are optional checkboxes. The Copy Header Lines from Input File checkbox allows the user to copy the header lines identified as present in the Input File over as header lines to the output files. Add Header Lines allows the user to type in additional header lines to be put into the output files. The Edit.. buttons brings up a text box to type in the additional lines, and when saved, the number of additional lines is displayed in the adjacent box. The Create R Data File option allows the R session for generating the ensembles to be saved so that it can be reopened later in R. The path for the saved file can be typed in or selected with the file chooser button.
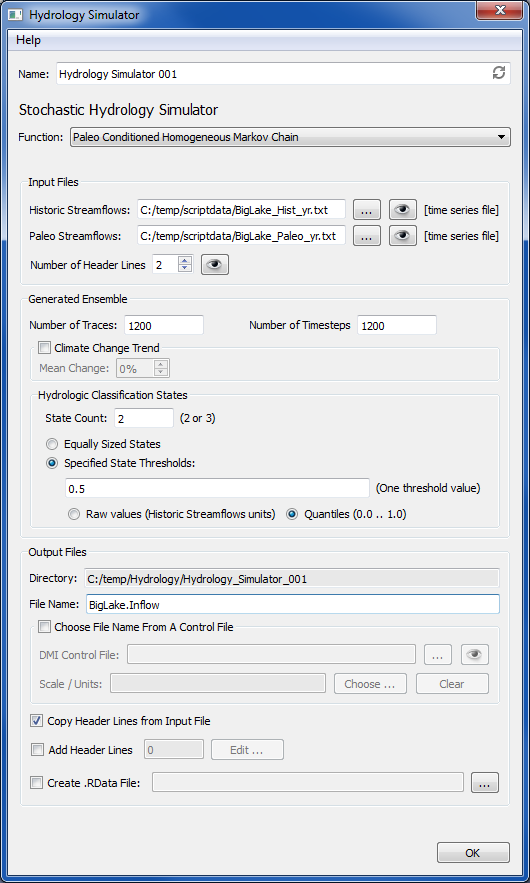
In the Input Files frame, the user can type in file names for Historic Streamflows and Paleo Streamflows or can select files via file chooser buttons. Historic Streamflows are a single time series of observed historic flows for the desired site. Paleo Streamflows are a single time series of paleo-reconstructed streamflows for the site. The R scripts expect that the files will start with data values. If there are non-data header lines in the Historic Streamflows file, the number of lines to skip can be specified by the user with the Number of Header Lines spin box. The eye icon will bring up a viewer showing this file (if the file exists) allowing the user to see what header lines are present.
The Generated Ensemble frame contains controls to configure ensemble information. The number of traces to generate in the ensemble and the number of timesteps to put into each trace are specified here. The optional Climate Change Trend control allows a positive or negative percent change to be applied, so that over the course of all the timesteps in the trace, values will trend up or down by this percent.
The Hydrologic Classification States controls allow definition of the hydrologic states used in the calculations. The State Count can be 2 or 3 (i.e. corresponding to "dry/wet," or "very dry/normal/very wet" for classifying the hydrology for each year). Radio buttons allow the given number of states to be equally sized or have their sizes specified by entering the separating threshold values in a line widget (comma separated if there are more than 2 states). Radio buttons allow the entered threshold values to represent either flow values or quartiles (from 0.0 to 1.0).
The Output Files frame contains a number of controls for specifying output generated by the plugin. The output directory is determined by the study manager and is displayed as read-only here for information purposes (this directory is named with the name of the plugin and is located under the Hydrology subdirectory of the study's directory). A directory for each trace, named trace1, trace2, etc., will be created under the output directory. The File Name is the name that will be given to the resulting output file generated in each trace directory. This name (typically a site name) can be typed in by the user, or optionally selected from a RiverWare DMI control file. If this option is chosen, the DMI Control File name can be typed in or chosen with a file selector button. The eye icon will allow the user to view the entire control file. The Choose... button brings up a list of the slot names present in the control file and the user can select one that will be populated to the File Name line. If the slot has units specified in the control file, the Scale/Units line will also be populated (this is for informational purposes only and has no impact in changing the ensemble calculations). The Clear button will clear out entries in the File Name and Scale/Units lines.
The remaining controls in the Output Files frame are optional checkboxes. The Copy Header Lines from Input File checkbox allows the user to copy the header lines identified as present in the Input File over as header lines to the output files. Add Header Lines allows the user to type in additional header lines to be put into the output files. The Edit.. buttons brings up a text box to type in the additional lines, and when saved, the number of additional lines is displayed in the adjacent box. The Create R Data File option allows the R session for generating the ensembles to be saved so that it can be reopened later in R. The path for the saved file can be typed in or selected with the file chooser button.
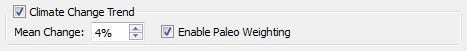
Interface controls for the Paleo Conditioned Nonhomogeneous Markov Chain function are the same as discussed above for the homogeneous function, except there is an additonal optional checkbox in the Climate Change Trend controls to Enable Paleo Weighting for the climate change calculation.
The R Project for Statistical Computing along with some of its component packages must be installed on the user's computer for the Hydrology Simulator to successfully generate ensemble flow data. The following steps describe how to install R and its packages:
---
[CADSWES; 12-17-2012]